Appendix B — Fieldwork Metrics
This annex analyses fieldwork progress. The data comprises of 77,300 (non-test) form submissions running from 2025-02-22 up until 2025-07-03.
B.1 Daily Tallies
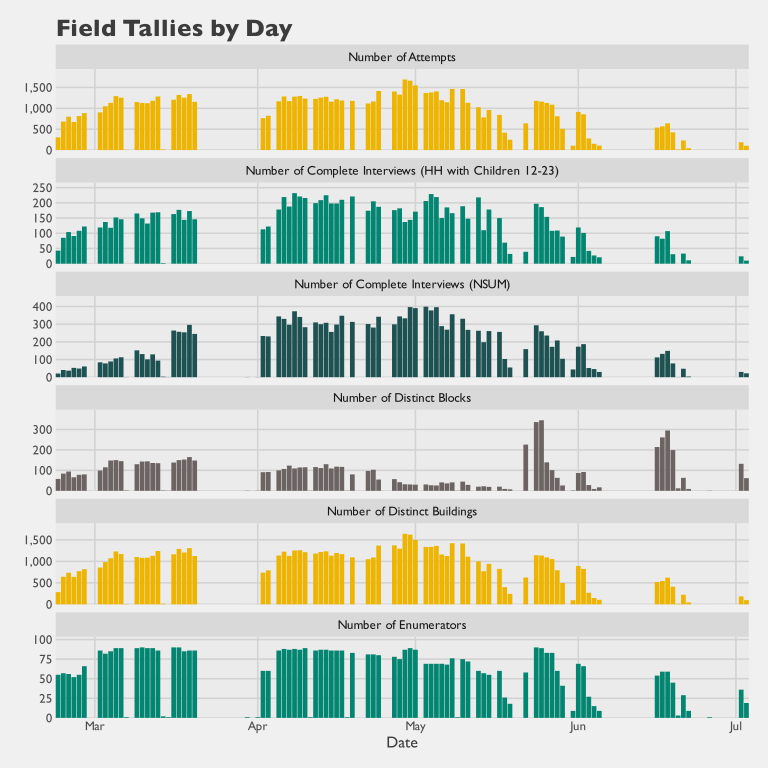
Figure B.1 tallies the daily number of attempts (door knocks), the daily number of buildings visited, the daily number of blocks visited, and the unique number of enumerators submitting forms per day.
The real field-work started on mid-February. During the main period, roughly 900 door knocks were attempted on a fieldwork day, with some 140 blocks and 1100 buildings visited daily. When work was in full swing, there were typically 90 enumerators in the field per day submitting forms (the number may be higher if there are supervisors who do not submit forms).
Figure B.2 shows the daily number of successful interviews by Local Government Area (LGA):
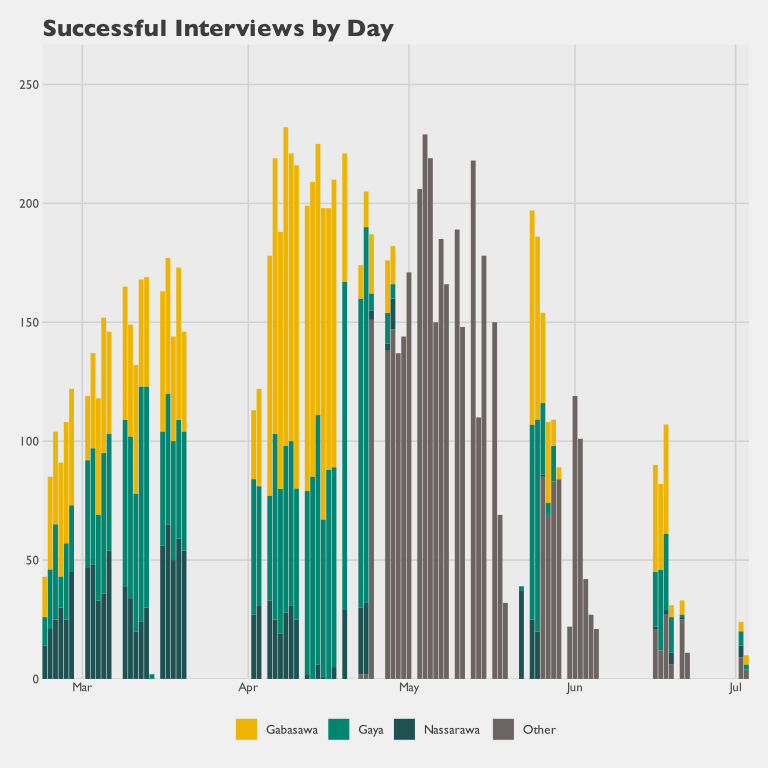
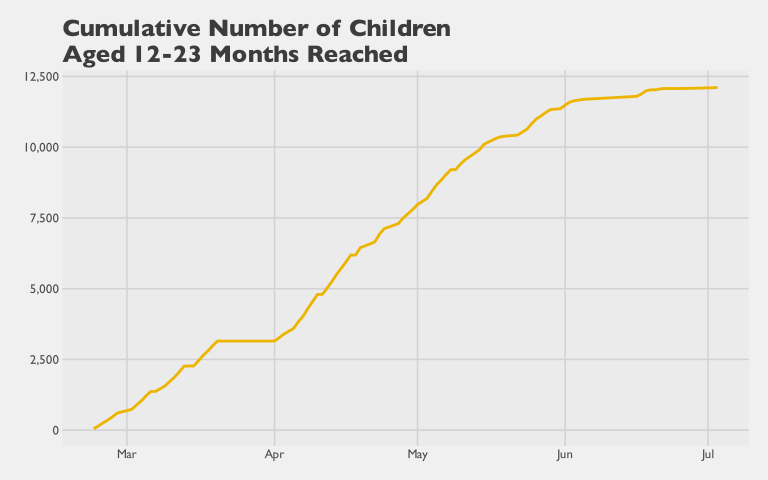
Figure B.3 shows the cumulative total of interviews.
B.2 Outcome Rates
Buildings Attempted | Residential Buildings | Interviews with HH (0-23) | Infants Reached | e | RR3 | CON2 | COOP3 | REF2 | ||
|---|---|---|---|---|---|---|---|---|---|---|
0-23 | 12-23 | |||||||||
State | ||||||||||
Kano | 72,956 | 73% | 21,048 | 24,953 | 12,004 | 48% | 80% | 87% | 92% | 7% |
LGA | ||||||||||
Gabasawa | 15,184 | 75% | 5,912 | 7,302 | 3,410 | 58% | 87% | 92% | 93% | 6% |
Gaya | 15,181 | 74% | 5,299 | 6,543 | 3,146 | 53% | 86% | 92% | 92% | 7% |
Nassarawa | 15,081 | 73% | 2,399 | 2,606 | 1,309 | 29% | 71% | 81% | 88% | 10% |
Tudun Wada | 1,906 | 81% | 763 | 896 | 428 | 56% | 87% | 93% | 94% | 5% |
Takai | 1,625 | 71% | 589 | 664 | 327 | 57% | 87% | 90% | 96% | 4% |
Bebeji | 1,510 | 76% | 526 | 637 | 312 | 53% | 84% | 90% | 94% | 5% |
Sumaila | 2,528 | 73% | 855 | 982 | 461 | 54% | 83% | 93% | 90% | 10% |
Kiru | 2,255 | 72% | 799 | 962 | 518 | 59% | 81% | 91% | 88% | 11% |
Dawakin Tofa | 1,950 | 64% | 516 | 584 | 264 | 50% | 81% | 87% | 92% | 7% |
Dawakin Kudu | 2,194 | 71% | 656 | 735 | 357 | 50% | 80% | 86% | 93% | 6% |
Gezawa | 1,287 | 74% | 423 | 506 | 254 | 54% | 79% | 85% | 92% | 6% |
Dambatta | 1,968 | 73% | 482 | 552 | 256 | 42% | 79% | 87% | 91% | 8% |
Ungogo | 3,147 | 71% | 644 | 717 | 341 | 39% | 71% | 79% | 90% | 8% |
Kumbotso | 5,741 | 67% | 1,015 | 1,088 | 533 | 37% | 68% | 78% | 87% | 10% |
Tarauni | 1,399 | 79% | 170 | 179 | 88 | 29% | 48% | 62% | 77% | 14% |
Urban/Rural | ||||||||||
Rural | 38,264 | 74% | 14,225 | 17,389 | 8,248 | 57% | 85% | 92% | 92% | 7% |
Urban | 34,692 | 72% | 6,823 | 7,564 | 3,756 | 35% | 73% | 81% | 90% | 8% |
Building Confidence | ||||||||||
< 70% | 13,743 | 72% | 4,099 | 4,922 | 2,405 | 49% | 82% | 89% | 92% | 7% |
70% - 75% | 16,356 | 73% | 4,877 | 5,765 | 2,750 | 48% | 82% | 88% | 92% | 7% |
75% - 80% | 19,457 | 76% | 5,711 | 6,809 | 3,274 | 47% | 80% | 87% | 92% | 7% |
80% - 85% | 16,372 | 75% | 4,806 | 5,628 | 2,701 | 48% | 79% | 86% | 92% | 7% |
>= 85% | 7,169 | 66% | 1,555 | 1,829 | 874 | 44% | 71% | 80% | 88% | 9% |
Building Area | ||||||||||
< 15 sq. meters | 16,924 | 72% | 5,431 | 6,518 | 3,086 | 52% | 83% | 90% | 92% | 7% |
15 - 25 sq. meters | 15,366 | 74% | 4,626 | 5,489 | 2,657 | 49% | 81% | 89% | 91% | 8% |
25 - 35 sq. meters | 11,730 | 76% | 3,602 | 4,323 | 2,100 | 48% | 82% | 88% | 93% | 7% |
35 - 55 sq. meters | 14,270 | 76% | 4,344 | 5,104 | 2,460 | 48% | 81% | 88% | 92% | 7% |
>= 55 sq. meters | 14,808 | 70% | 3,045 | 3,519 | 1,701 | 40% | 71% | 80% | 89% | 9% |
Morphological Settlement Zone (GHSL) | ||||||||||
Unbuilt area | 6,329 | 56% | 1,671 | 2,032 | 963 | 55% | 81% | 89% | 91% | 8% |
Low vegetation | 7,931 | 75% | 1,785 | 2,007 | 975 | 38% | 75% | 84% | 89% | 9% |
Medium vegetation | 12,420 | 75% | 4,178 | 4,995 | 2,361 | 53% | 82% | 88% | 93% | 7% |
High vegetation | 5,119 | 69% | 1,583 | 1,892 | 837 | 56% | 79% | 86% | 91% | 8% |
Road & Water | 281 | 49% | 72 | 95 | 39 | 60% | 88% | 90% | 97% | 2% |
Residential (<=3m) | 11,394 | 75% | 4,416 | 5,442 | 2,606 | 58% | 86% | 93% | 93% | 7% |
Residential (3-6m) | 3,560 | 73% | 1,246 | 1,534 | 731 | 56% | 83% | 90% | 93% | 7% |
Residential (6-15m) | 17,514 | 75% | 4,526 | 5,238 | 2,649 | 43% | 77% | 84% | 91% | 7% |
Residential (15-30m) | 8,390 | 81% | 1,564 | 1,711 | 839 | 29% | 76% | 85% | 90% | 9% |
Non-Residential | 110 | 23% | 7 | 7 | 4 | 32% | 88% | 88% | 100% | 0% |
Settlement Typology (GHSL) | ||||||||||
Mostly uninhabited area | 555 | 43% | 111 | 122 | 46 | 54% | 85% | 92% | 92% | 7% |
Dispersed rural area | 4,912 | 67% | 1,662 | 2,033 | 982 | 58% | 83% | 92% | 90% | 10% |
Village | 2,069 | 76% | 858 | 1,045 | 499 | 60% | 88% | 93% | 94% | 5% |
Suburban or peri-urban area | 19,043 | 75% | 7,244 | 8,938 | 4,243 | 57% | 86% | 93% | 93% | 7% |
Semi-dense town | 3,814 | 79% | 1,613 | 2,025 | 964 | 59% | 87% | 93% | 94% | 6% |
Dense town | 11,123 | 75% | 3,848 | 4,579 | 2,196 | 52% | 85% | 91% | 93% | 6% |
City | 31,450 | 72% | 5,712 | 6,211 | 3,074 | 34% | 71% | 80% | 89% | 9% |
Day of the Week | ||||||||||
Sunday | 12,233 | 73% | 3,560 | 4,247 | 2,072 | 48% | 80% | 88% | 92% | 7% |
Monday | 11,579 | 74% | 3,320 | 3,961 | 1,918 | 47% | 80% | 87% | 92% | 7% |
Tuesday | 12,903 | 71% | 3,581 | 4,248 | 2,004 | 48% | 79% | 86% | 91% | 8% |
Wednesday | 13,838 | 73% | 3,943 | 4,738 | 2,268 | 47% | 79% | 87% | 92% | 7% |
Thursday | 14,281 | 74% | 3,906 | 4,552 | 2,192 | 46% | 79% | 86% | 91% | 8% |
Fri/Sat | 8,600 | 75% | 2,738 | 3,207 | 1,550 | 50% | 82% | 89% | 92% | 7% |
Ramadan | ||||||||||
Non-holiday | 56,180 | 73% | 16,670 | 19,680 | 9,492 | 49% | 80% | 87% | 92% | 7% |
Ramadan | 16,884 | 73% | 4,378 | 5,273 | 2,512 | 43% | 80% | 87% | 92% | 7% |
Time of Day | ||||||||||
Before 10 AM | 8,928 | 72% | 2,530 | 3,065 | 1,457 | 48% | 81% | 87% | 93% | 6% |
10 AM - 11 AM | 11,356 | 73% | 3,257 | 3,897 | 1,903 | 47% | 80% | 87% | 92% | 7% |
11 AM - 12 PM | 13,028 | 74% | 3,668 | 4,376 | 2,141 | 47% | 79% | 86% | 91% | 7% |
12 PM - 1 PM | 12,390 | 74% | 3,546 | 4,197 | 1,995 | 47% | 79% | 87% | 91% | 8% |
1 PM - 2 PM | 10,071 | 74% | 2,919 | 3,490 | 1,710 | 48% | 80% | 88% | 91% | 8% |
2 PM - 3 PM | 7,910 | 74% | 2,270 | 2,656 | 1,278 | 47% | 81% | 88% | 92% | 7% |
3 PM - 4 PM | 5,631 | 72% | 1,625 | 1,857 | 834 | 49% | 80% | 88% | 91% | 8% |
After 4 PM | 4,374 | 69% | 1,233 | 1,415 | 686 | 52% | 77% | 85% | 91% | 8% |
e: The proportion of cases of unknown eligibility estimated to be eligible. Because the cases of unknown eligibility are dominated by cases where the eligibility of the household is unknown (rather than where the eligibility of the building is unknown), this rate is virtually identical to the proportion of households with children 0-23 months. | ||||||||||
RR3: The estimated proportion of eligible households with infants 0-23 that result in a complete interview. | ||||||||||
CON2: The estimated proportion of eligible households with infants 0-23 that resulted in human contact (i.e., someone answering the door). | ||||||||||
COOP3: The proportion of individuals reached in households with infants 0-23 who agree to participate in the survey process. The denominator excludes cases where contact was unsuccessful. | ||||||||||
REF2: The estimated proportion of households with infants 0-23 who refuse to participate in the survey (the denominator includes non-contact cases). | ||||||||||
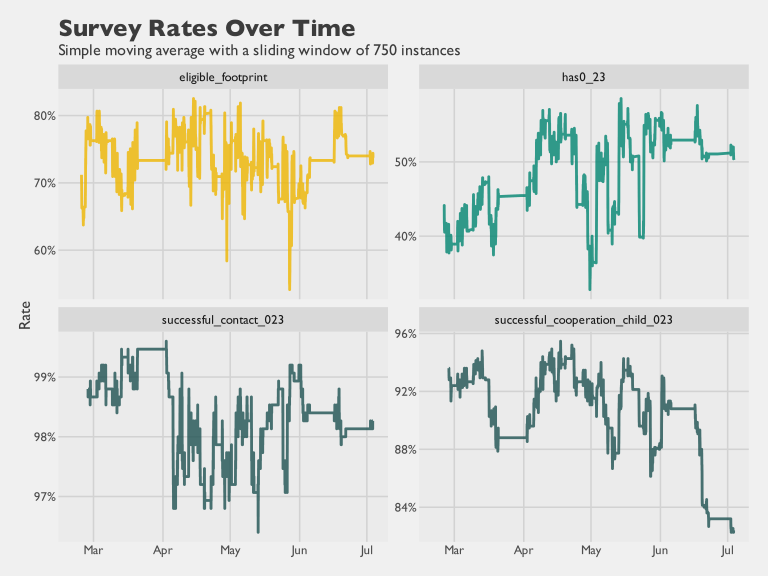
We can also achieve something similar to the outcome rates by plotting these rates over time as a moving average.
B.2.1 Regression Models
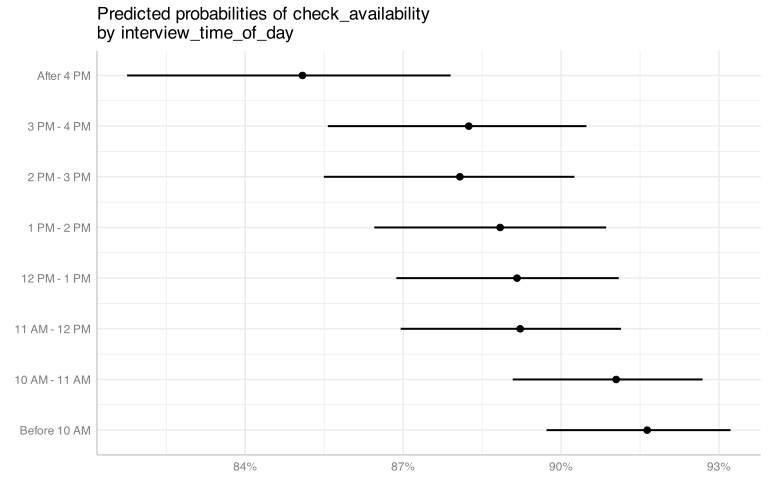
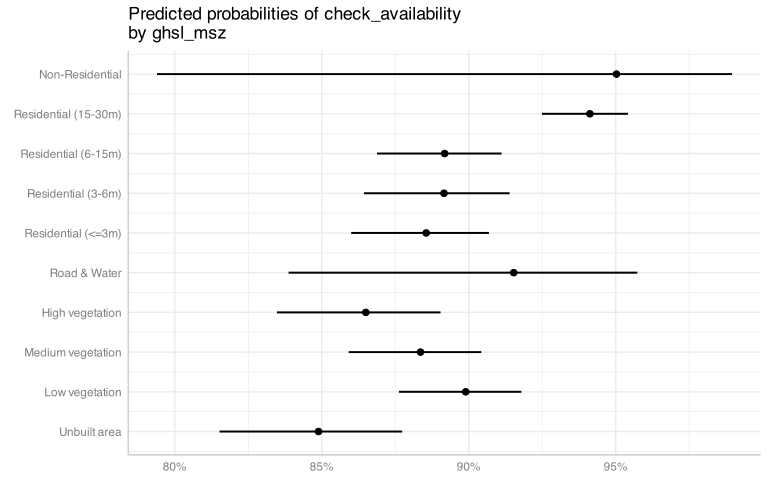
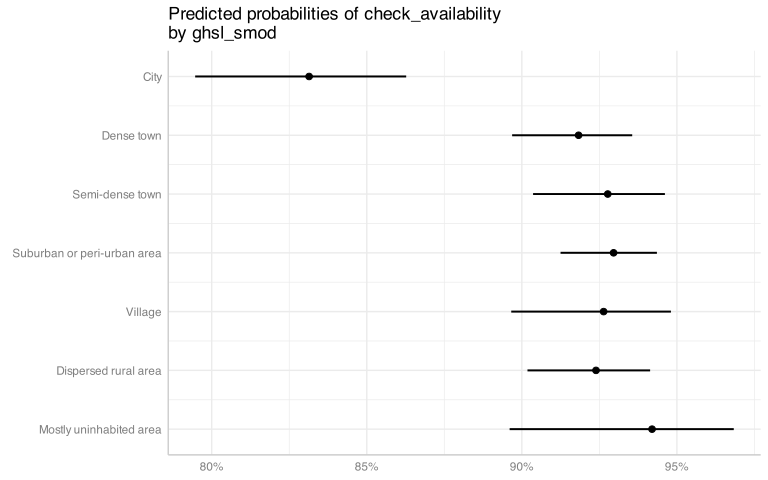
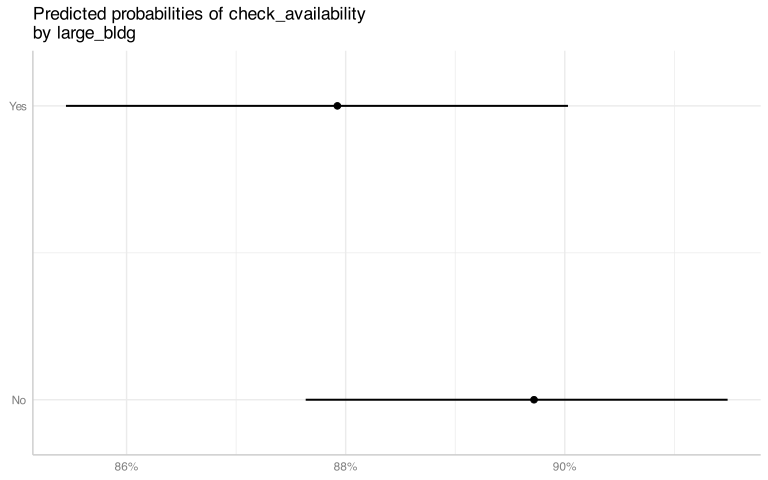
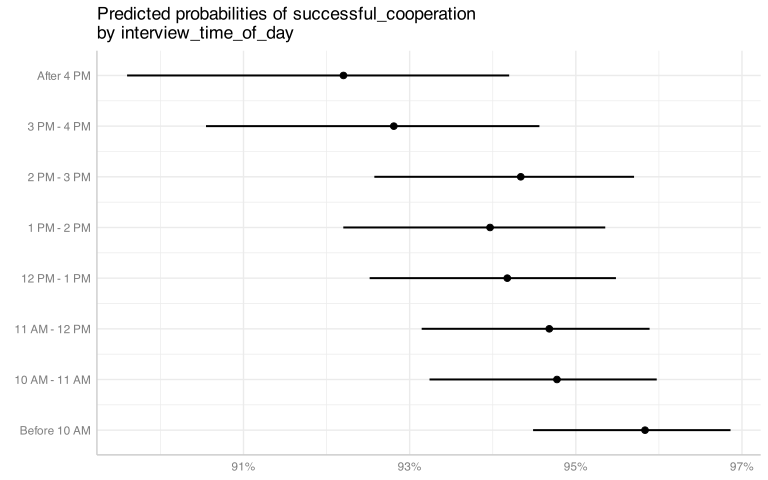
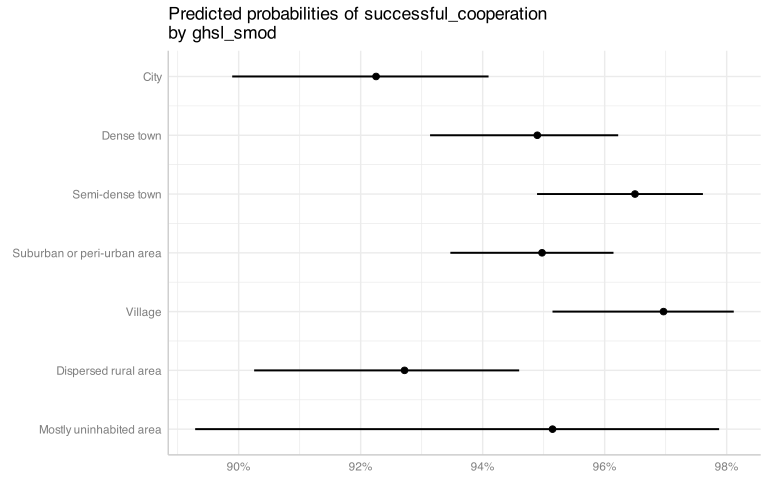
As discussed in Chapter 3, Mindset modeled the different field outcomes as two multi-level logistic regression models estimating (1) the probability that a household answers the door (i.e., the contact rate), and (2) the probability that a reached eligible household with an infant accepts to participate in the survey (i.e., the cooperation rate). Table B.2 and Table B.3 display the significance levels of each model.
term | statistic | df | p.value |
|---|---|---|---|
interview_time_of_day | 90.69 | 7 | <0.001 |
ghsl_msz | 96.28 | 9 | <0.001 |
ghsl_smod | 79.30 | 6 | <0.001 |
large_bldg | 22.48 | 1 | <0.001 |
term | statistic | df | p.value |
|---|---|---|---|
interview_time_of_day | 33.13 | 7 | <0.001 |
ghsl_smod | 40.97 | 6 | <0.001 |
The figures below show the marginal fixed effects of the two models.
B.3 Protocol Deviations and Fieldwork Challenges
No large, multi-method household survey is executed exactly as written. This section gathers the main deviations from the zero-dose (Zero-Dose (ZD)) fieldwork protocol and the operational challenges the teams encountered in Kano, so that readers can weigh the analytic implications alongside the point estimates presented elsewhere in the report. It draws on the fieldwork data already summarised in this annex (daily tallies, outcome rates, regression models), the methodology decisions recorded in Chapter 3, and after-action reviews with Mindset staff. Figures cited below should be read as preliminary estimates, pending final reconciliation with the underlying data files.
B.3.1 Sample-size overshoot and the representativeness of the pilot
The baseline study was planned to reach approximately 5,200 children aged 12–23 months; preliminary tallies indicate close to 10,000 were reached — roughly double the target. The pilot study used to set per-footprint yield assumptions was drawn primarily from Nassarawa, where the yield of eligible infants per sampled footprint was around 7–8%; the other sentinel LGAs (Gaya and Gabasawa) ran closer to twice that yield, which is what drove the overshoot in those areas. The operational lesson — carried forward into planning for future studies — is that pilot samples used to calibrate yield assumptions should be balanced across strata rather than concentrated in a single LGA.
B.3.2 Sentinel Stage-2 subsampling and multiplicity capture
The protocol instructed enumerators, where a sampled building contained more than two residential units, to randomly subsample two (see Chapter 3). In practice, the final data set contains only one household for many buildings that were listed as multi-dwelling units.
A related issue is the building-level multiplicity question, which asks respondents to identify other buildings belonging to the same household. Respondents viewed a pre-prepared map showing footprints around their current building and pointed out the relevant buildings visually; the enumerator then translated those visual responses into a text reference to the footprint, entered into a free-text field. The resulting open-text entries required extensive manual cleaning, with inconsistent formats and irrelevant comments, and the team lacks confidence that enumerators consistently transcribed the intended building. One direction for future designs is to replace the free-text transcription with a map-based selection tool in which the enumerator taps the relevant building on the tablet. That would address the transcription layer only, however: multiplicity questions more broadly are difficult to answer where respondents are unfamiliar with maps — a particular concern with populations that have limited access to smartphones or digital mapping tools — so the quality of multiplicity data depends on respondent map literacy as much as on the data-capture tool. Buildings with multiple uses — for example a pharmacy downstairs and a residence upstairs — were also flagged as requiring clearer guidance on how the subsampling rule applies.
B.3.3 Geo-fencing and enumerator location tracking
The initial protocol set a maximum distance of 5 metres between the enumerator’s Global Positioning System (GPS) position and the target building, which proved too strict in the field. Dense urban settings such as Nassarawa tolerated a small threshold, but other settlement patterns — where the distance between the compound gate and the residence can be tens of metres — regularly triggered the geofence for reasons unrelated to protocol adherence. Separately, security guards denied access to some compounds and factory areas. Mindset staff reported that, of roughly 72,000 sampled footprints, about 270 were not captured, with approximately 70 of those due to security, terrain, rivers, or similar physical constraints and the remainder due to access denial or to the building sitting inside a restricted facility.
After-action reviews also surfaced two tracking issues that are relevant for future designs rather than adjustments to the current data: (i) enumerators occasionally saved surveys as drafts and only submitted them after leaving the target location, which inflated the distance between the start-location GPS stamp and the submission stamp; and (ii) no hard check enforced that the submission stamp be close to the start stamp. The recommendation is to set a variable maximum distance threshold based on the enumerator’s classification of the area (for example, a larger allowance for military or industrial sites) and to capture an additional midway GPS point as a monitoring measure.
B.3.5 Sampling-frame under-coverage
After-action reviews confirmed that the Google Open Buildings footprint layer matched the field reality well in aggregate, but that recently constructed buildings — those built after the footprint vintage used for sampling — are hard to detect and represent a source of under-coverage that the current design cannot fully measure. For future listing exercises, the recommended mitigation is a two-step review: a desk-based pass using recent satellite imagery to find missing buildings, followed by a field pass to identify buildings obscured by vegetation or other visual occlusions.
B.3.6 Technology and data-submission issues
Old tablets used at the start of the project produced errors and lags when loading preloaded data and maps, particularly for core data collection; these were replaced for the main fieldwork. Connectivity was patchy in some locations, and early attempts to push form updates while enumerators were already in the field occasionally produced form-version confusion. Synchronisation was the other recurring issue: a small number of enumerators failed to submit surveys in a timely way, with at least one case of 74 surveys submitted months after collection. The team has adopted a standard of using only recent tablet hardware for future data collection and is considering stricter supervisory sign-off on daily submission status.
The Computer-Assisted Personal Interviewing (CAPI) form identified each case by a serial number and paired it with a validation number used to catch clerical data-entry errors: if the two did not match against the loaded sample file, the form flagged the mismatch and would not proceed, ruling out wrong-code entries in the final submitted data. A small number of enumerators struggled repeatedly to enter the correct pair during testing; the proposed future improvement is to adopt non-sequential identifiers so that a single-character entry error is less likely to correspond to another valid case.
B.3.7 Implications for the head-to-head estimates
Taken together, the deviations above have two distinct implications for the head-to-head results. First, the Stage-2 subsampling behaviour and the multiplicity-capture issues feed directly into the weighting model described in Appendix D. Because multiplicity is partly inferred from respondent-reported, enumerator-transcribed building references, measurement error in multiplicity capture can propagate into both point estimates and variance — potentially beyond the magnitude of the bounded coverage loss discussed next — and should be treated as a distinct interpretation caveat. Second, the geofencing and navigation issues produced a small and bounded loss of footprint coverage (on the order of 270 out of ~72,000 footprints, with documented reasons), while the pilot-representativeness issue affected how the target sample size was set rather than the quality of any individual interview.