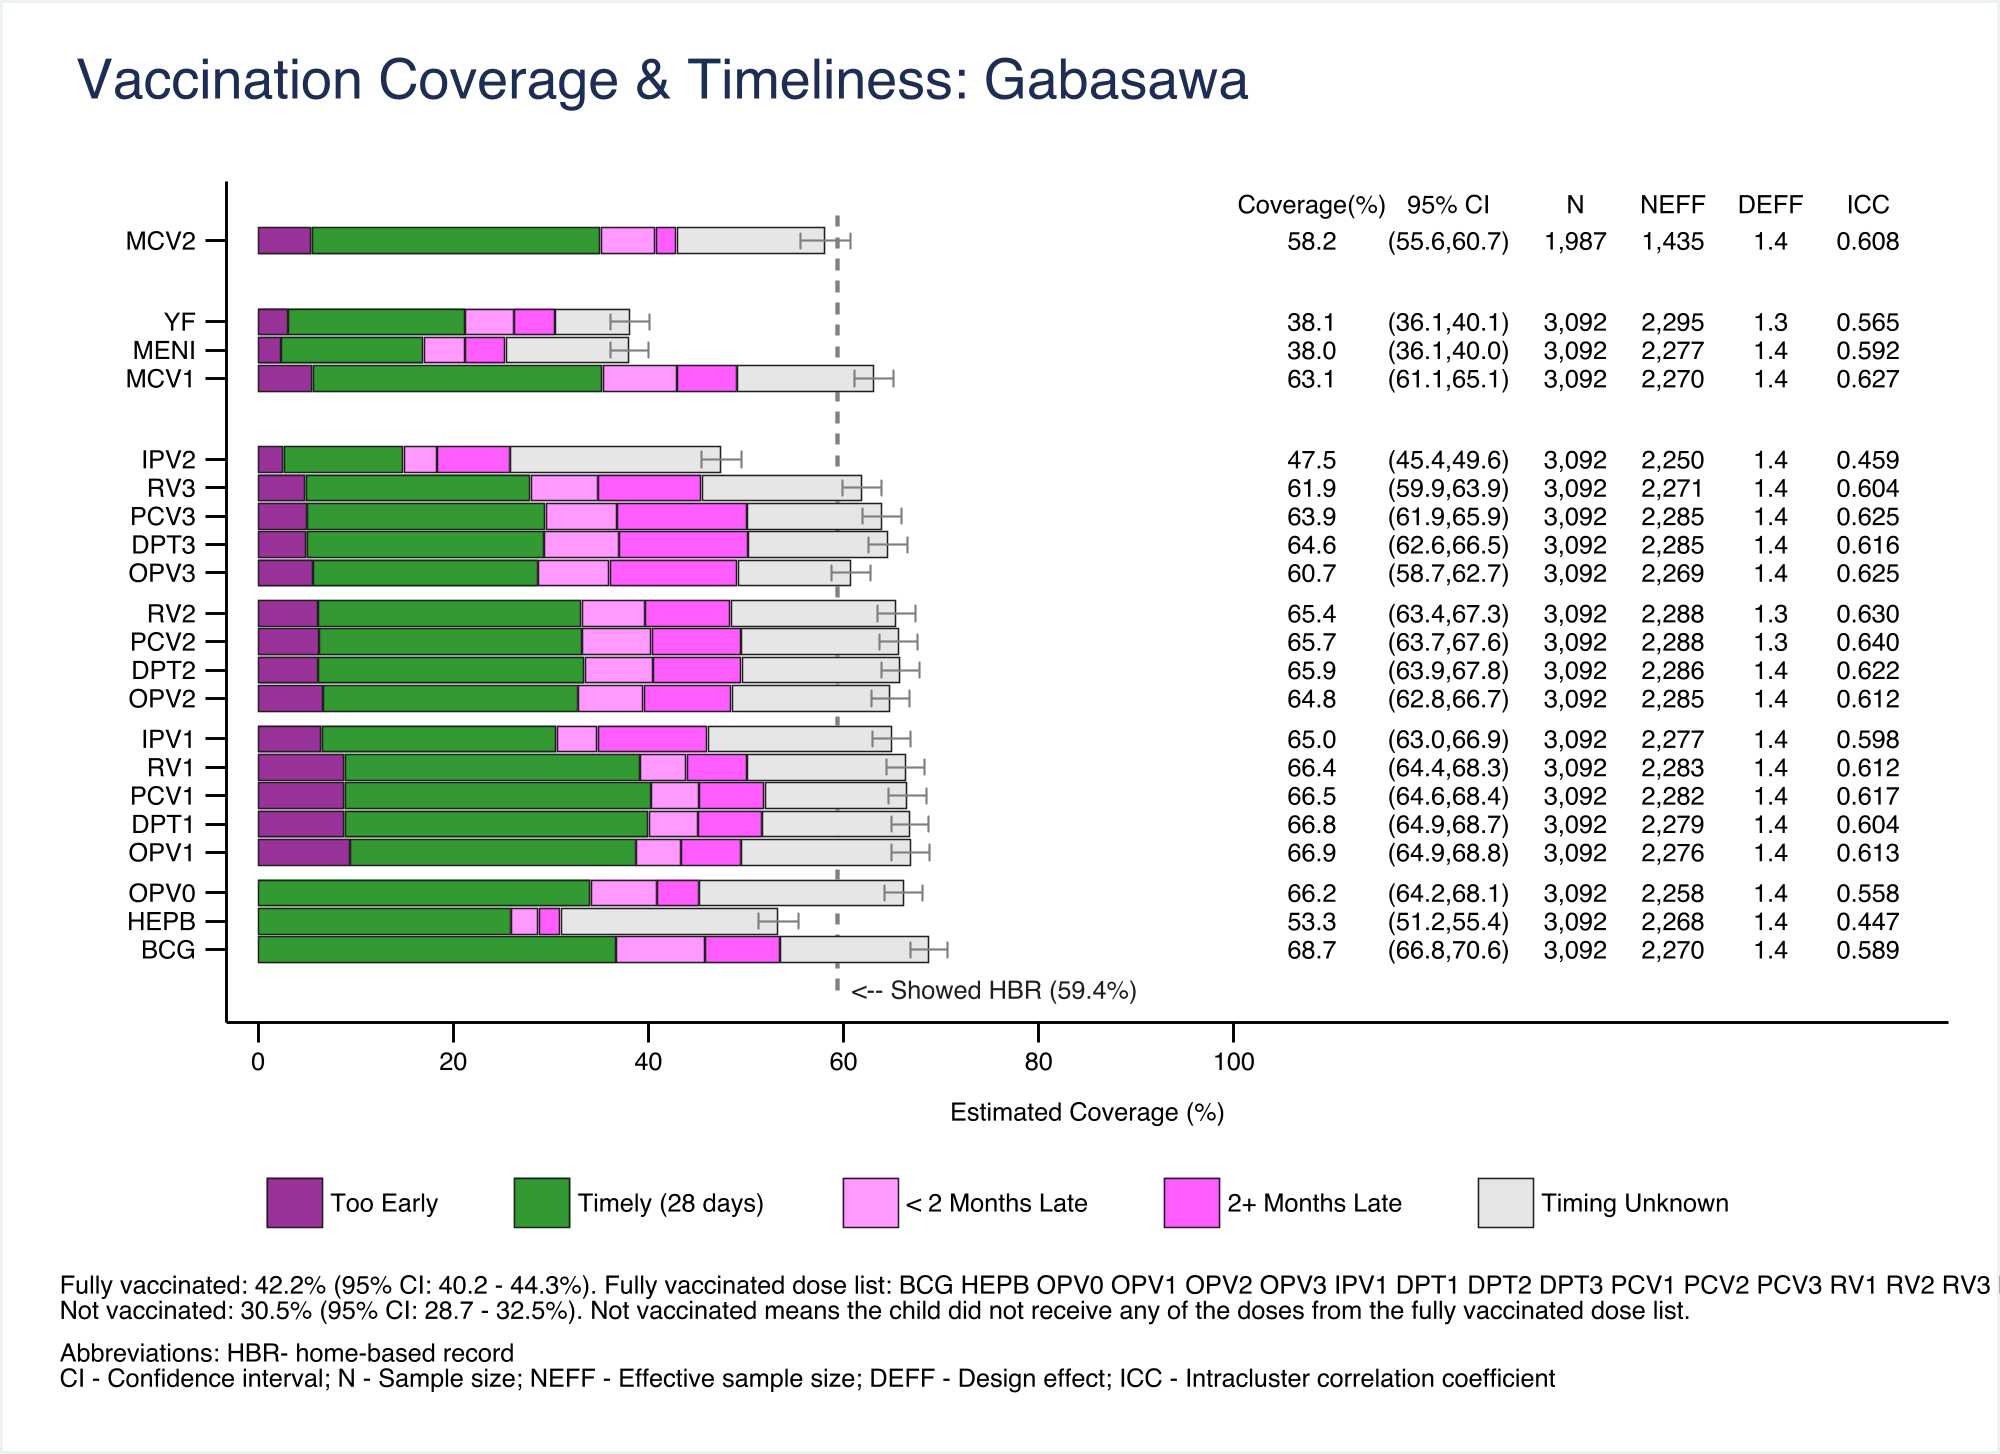
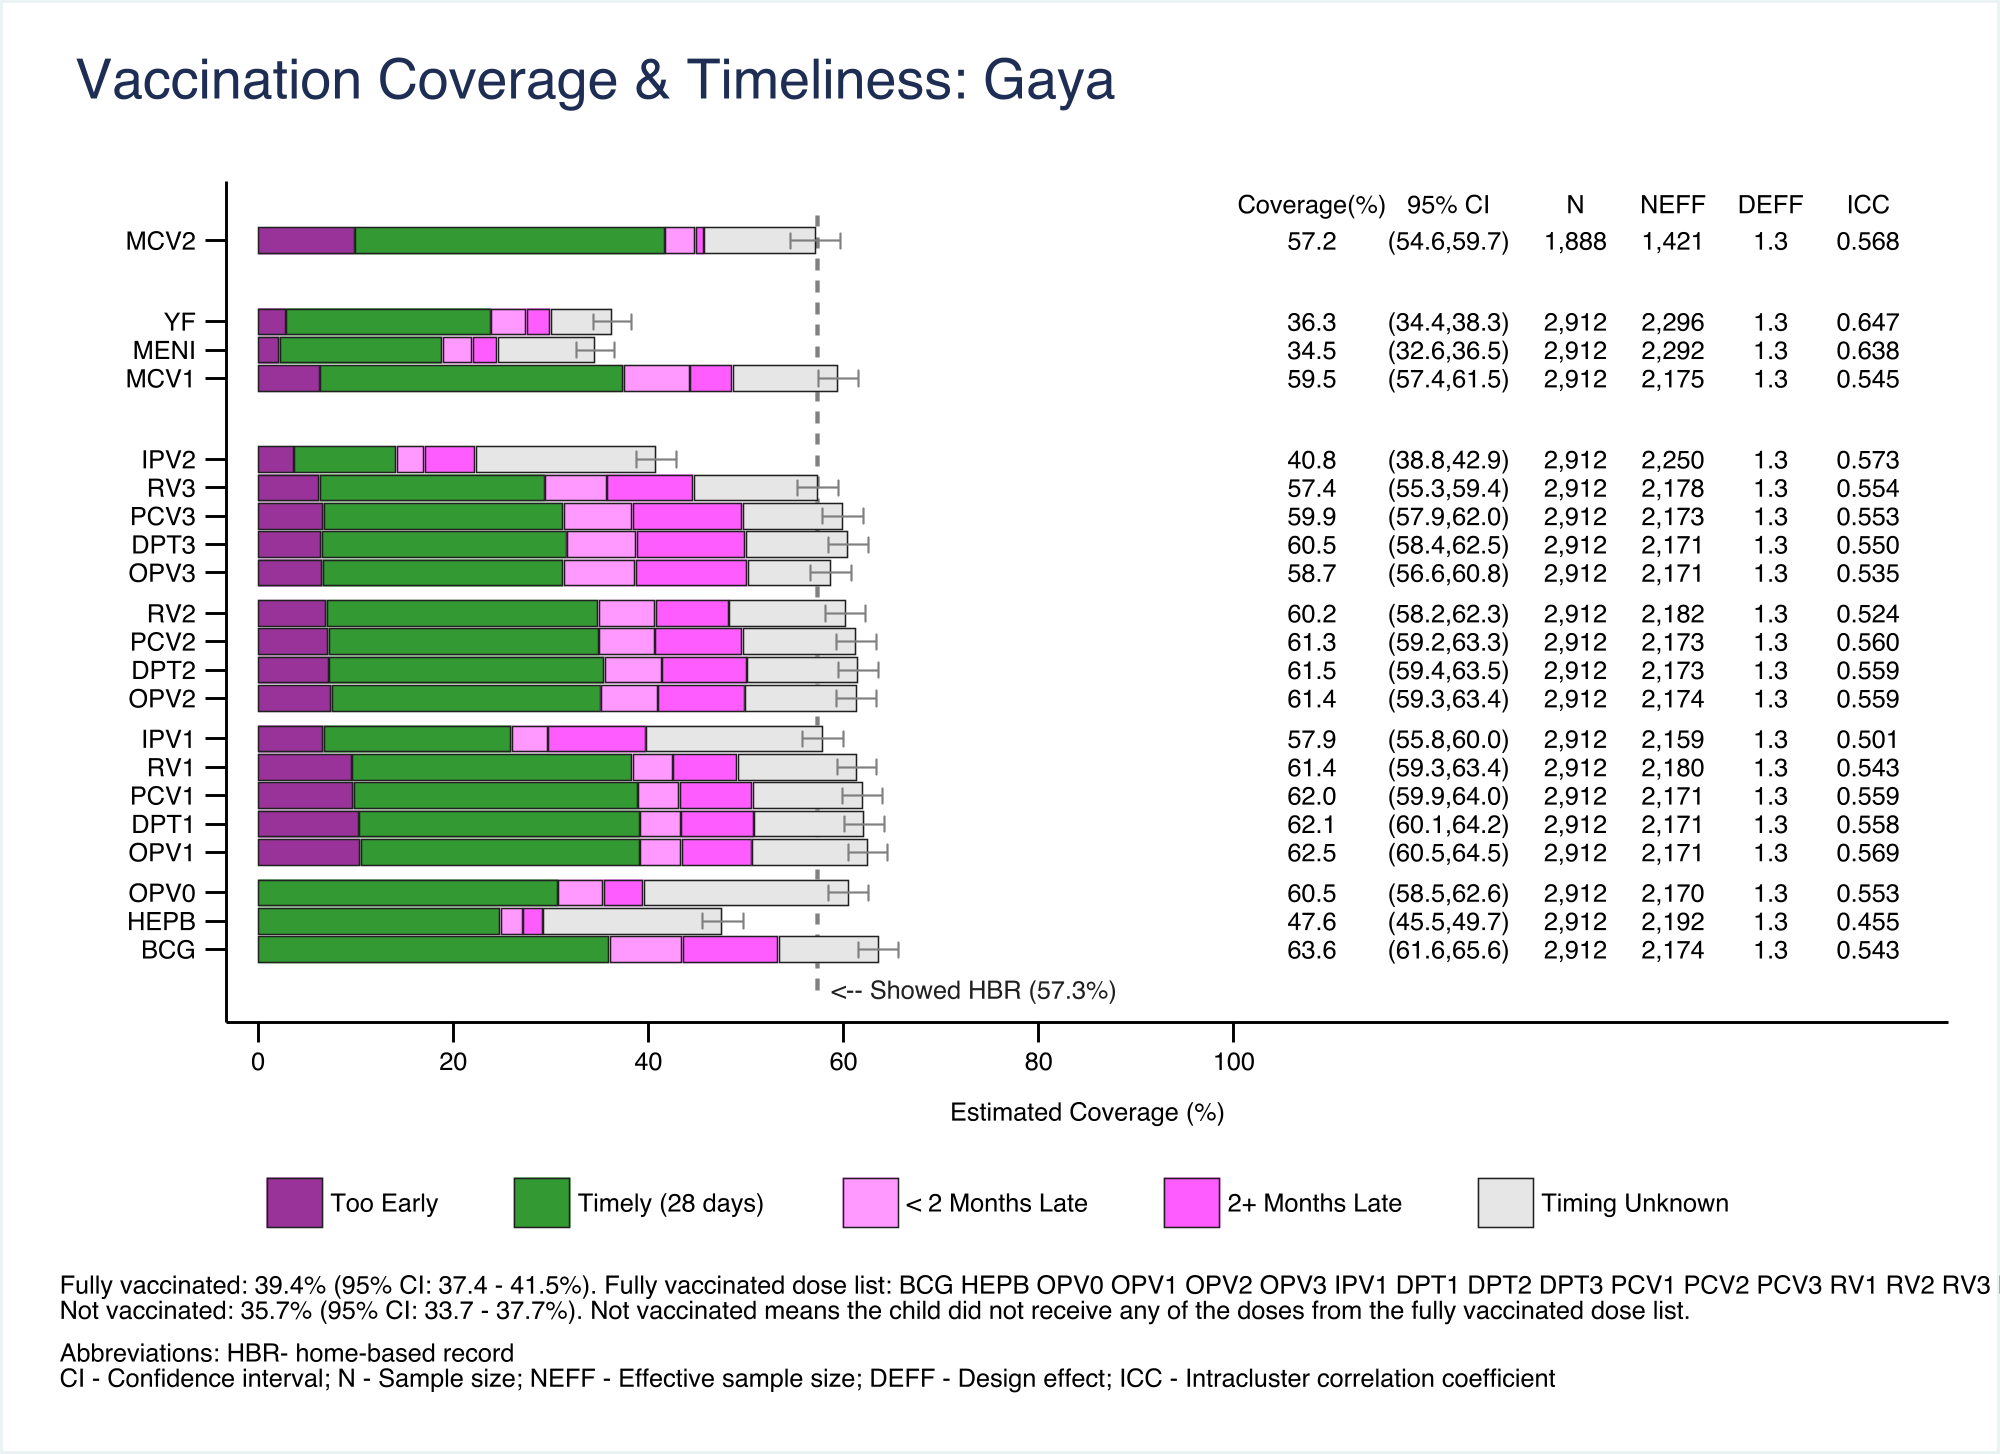
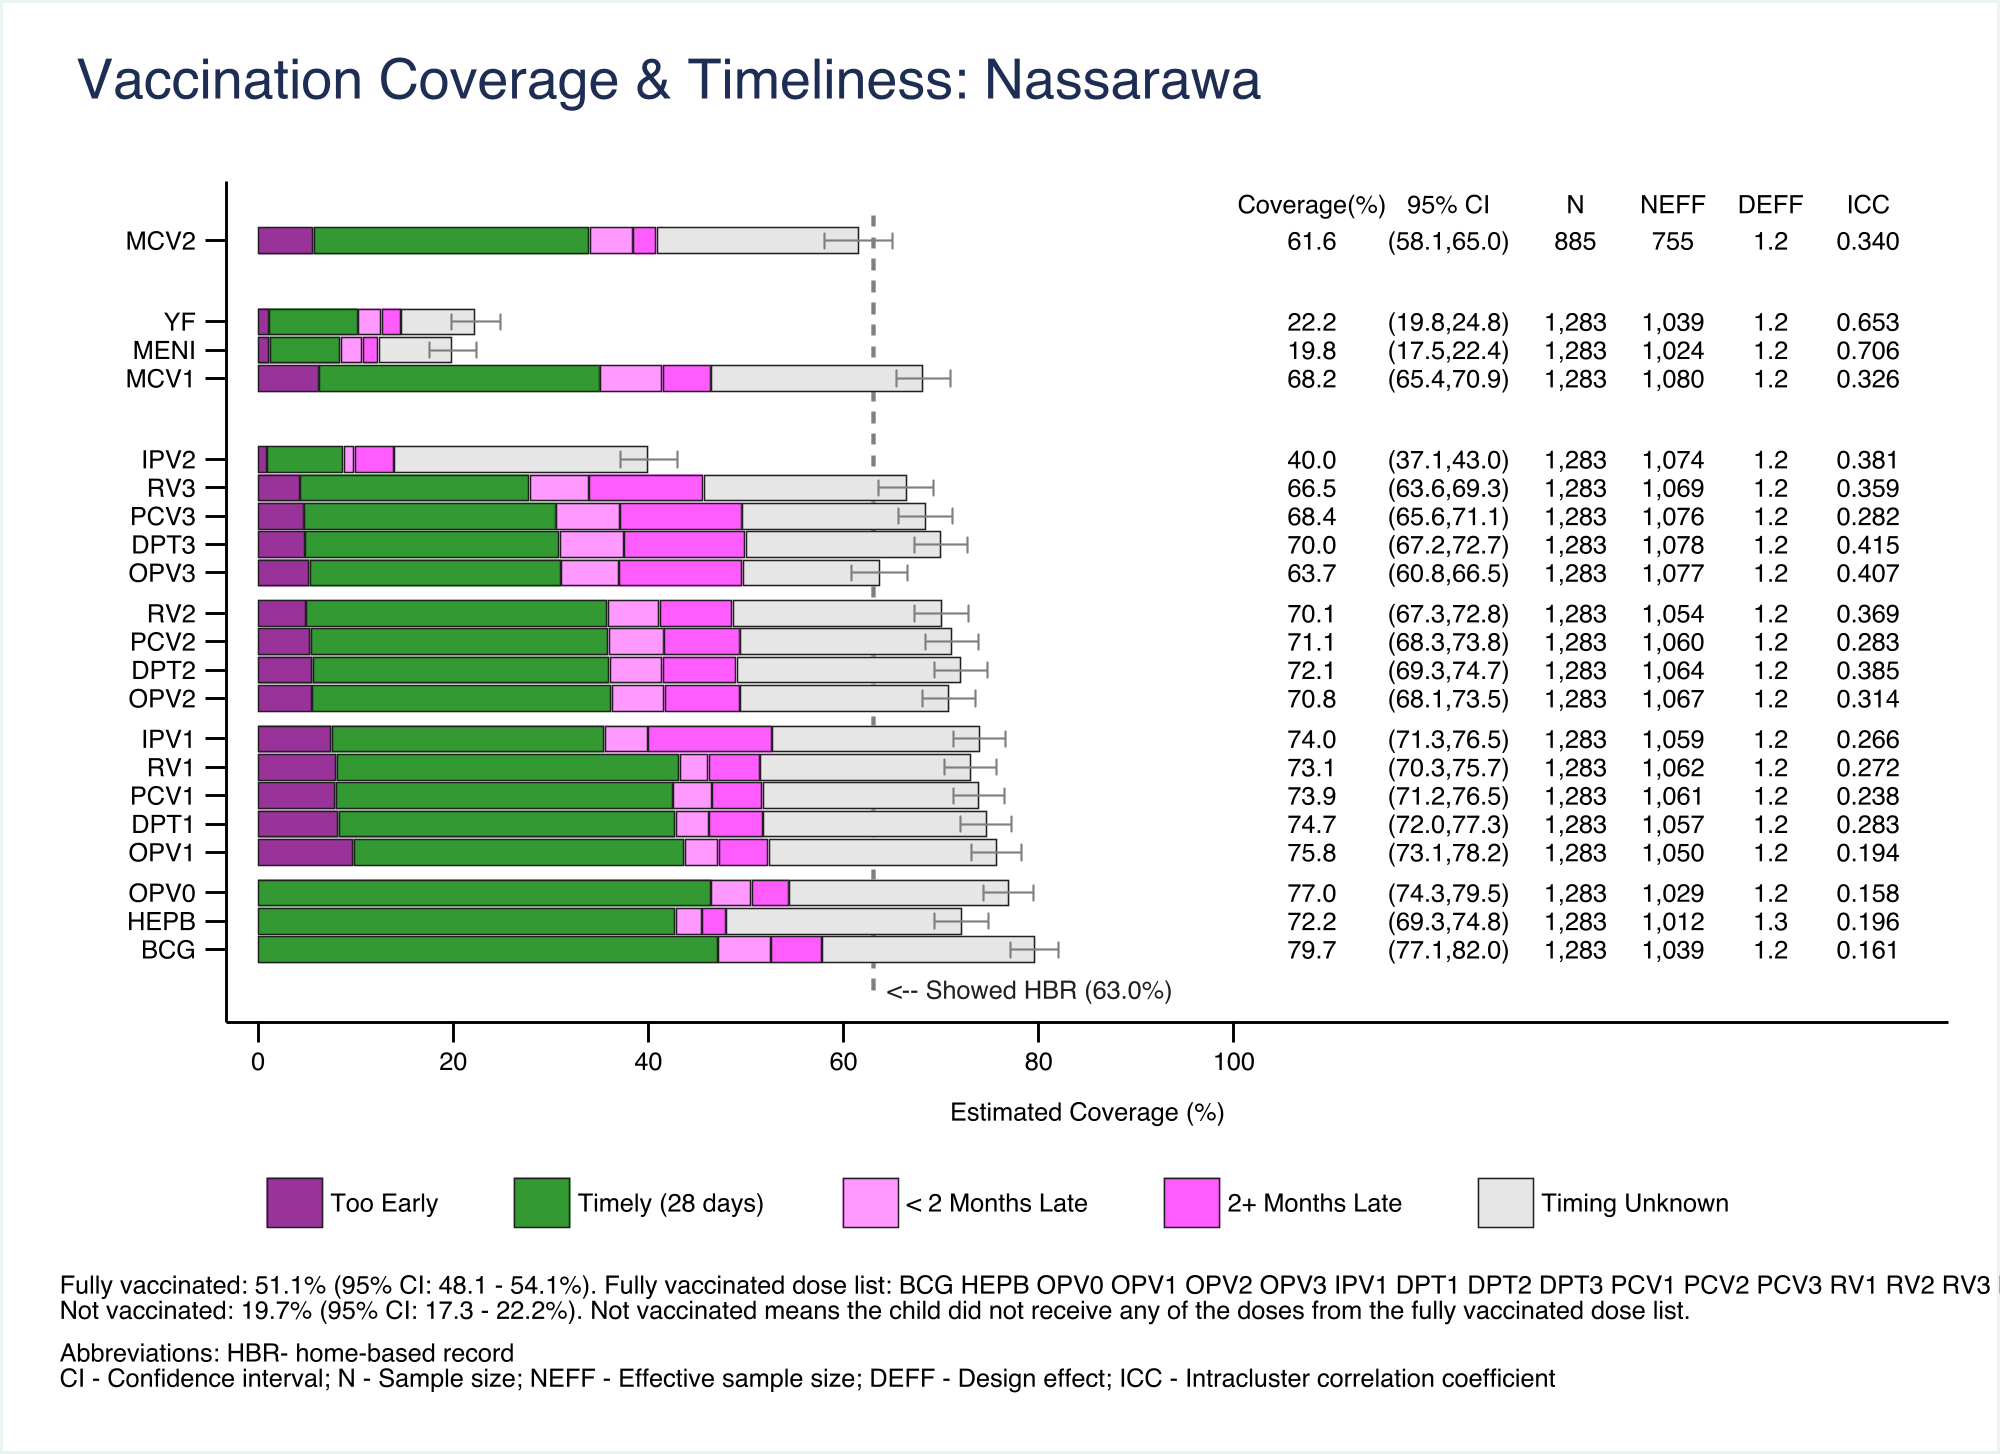
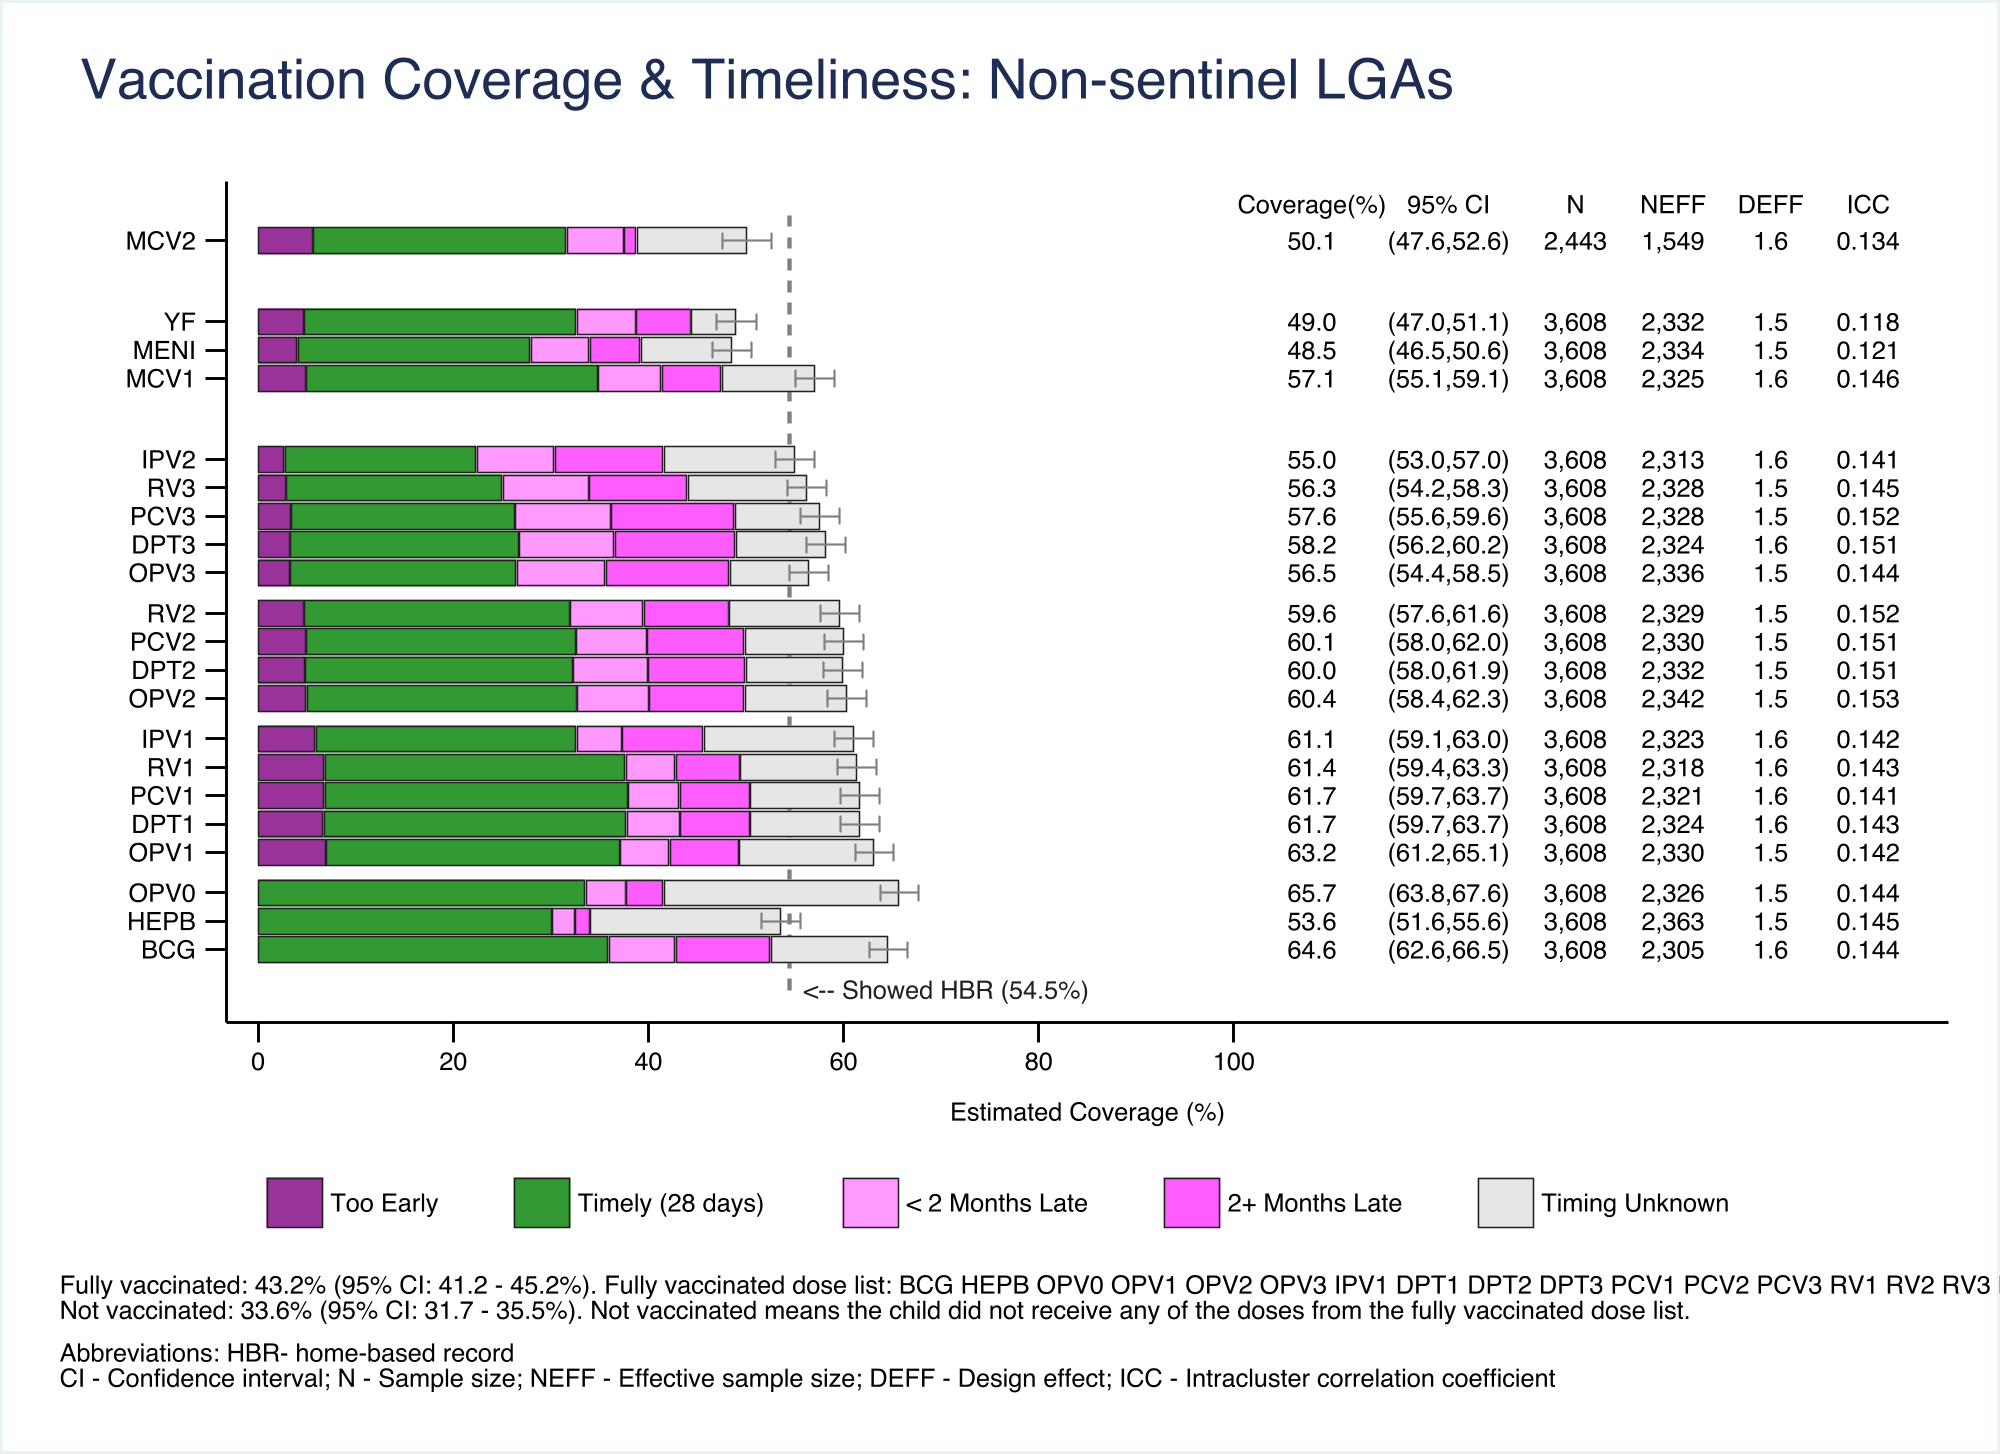
Appendix C — Vaccination Coverage Quality Indicators (VCQI) Output
The plots in this annex were produced by VCQI, which estimates Standard Errors (SEs) using Taylor-series linearization rather than the generalized bootstrap method described in Section D.2. The confidence intervals shown therefore reflect linearization-based variance estimates and are not directly comparable to those reported elsewhere in this document.
C.1 Vaccination Coverage and Timeliness