Number of children 0-23 months ('000) | Number of children 6-23 months ('000) | Number of children 12-23 months ('000) | Average children 0-23 months per HH | Sample | |||||
|---|---|---|---|---|---|---|---|---|---|
Estimate | MOE | Estimate | MOE | Estimate | MOE | Estimate | MOE | ||
Sentinel | 194.9 | ±7.8 | 144.5 | ±6.2 | 94.5 | ±4.9 | 0.50 | ±0.02 | 30,142 |
Gaya | 69.3 | ±3.0 | 52.1 | ±2.6 | 33.6 | ±2.1 | 0.65 | ±0.03 | 10,523 |
Gabasawa | 68.6 | ±4.3 | 50.8 | ±3.3 | 32.2 | ±2.4 | 0.73 | ±0.04 | 10,688 |
Nassarawa | 57.0 | ±2.4 | 41.6 | ±1.9 | 28.7 | ±1.7 | 0.30 | ±0.01 | 8,931 |
Non-sentinel | 998.0 | ±85.1 | 734.8 | ±58.8 | 473.4 | ±32.2 | 0.56 | ±0.04 | 16,353 |
Tudun Wada | 136.0 | ±30.1 | 99.5 | ±22.0 | 62.2 | ±12.8 | 0.68 | ±0.04 | 1,387 |
Ungogo | 134.7 | ±26.3 | 98.5 | ±18.7 | 60.7 | ±12.2 | 0.45 | ±0.05 | 1,733 |
Gezawa | 114.5 | ±24.8 | 87.0 | ±21.5 | 59.8 | ±15.5 | 0.70 | ±0.11 | 815 |
Sumaila | 96.7 | ±19.6 | 68.4 | ±14.4 | 45.8 | ±9.9 | 0.62 | ±0.05 | 1,666 |
Kumbotso | 82.7 | ±9.0 | 63.7 | ±7.0 | 40.6 | ±5.1 | 0.37 | ±0.03 | 2,917 |
Takai | 82.5 | ±17.8 | 60.2 | ±13.0 | 39.6 | ±8.4 | 0.68 | ±0.06 | 1,060 |
Dawakin Tofa | 80.9 | ±18.9 | 59.0 | ±13.9 | 36.1 | ±8.9 | 0.59 | ±0.05 | 1,072 |
Dawakin Kudu | 75.6 | ±14.2 | 53.5 | ±10.7 | 33.4 | ±7.5 | 0.56 | ±0.05 | 1,361 |
Kiru | 64.8 | ±10.6 | 49.7 | ±8.4 | 34.9 | ±6.2 | 0.70 | ±0.04 | 1,447 |
Bebeji | 58.5 | ±12.3 | 44.7 | ±10.0 | 26.9 | ±7.0 | 0.66 | ±0.06 | 1,022 |
Dambatta | 48.5 | ±11.0 | 33.4 | ±7.0 | 22.4 | ±5.2 | 0.53 | ±0.11 | 1,223 |
Tarauni | 22.6 | ±9.5 | 17.2 | ±7.8 | 11.1 | ±5.2 | 0.29 | ±0.07 | 650 |
All 15 LGAs | 1,192.9 | ±90.4 | 879.4 | ±62.7 | 567.9 | ±34.6 | 0.55 | ±0.03 | 46,495 |
Abbreviations: MOE = Margin of Error; HH = Household | |||||||||
aSample size of households answering the screening question upon initial contact | |||||||||
4 Findings
4.1 Demographics
The Kano Zero-Dose Baseline Survey sample is representative of Nigerian children who were aged 12–23 months in early 2025. The tables in this section summarize the estimated number of children, households and proportion of households with age-eligible children (Section 4.1.1), as well as selected demographic characteristics of the children (Section 4.1.2), caregivers (Section 4.1.3), and households (Section 4.1.4) in the sample.
4.1.1 Age-Eligible Children
Table 4.1 estimates the total and average number of children per household and survey area. It shows that there are an estimated 194 thousand children aged 0-23 months in the three sentinel Local Government Areas (LGAs), with roughly 69 thousand in each of Gaya and Gabasawa and 57 thousand in Nassarawa LGA. There are large differences in the average number of children per household in the three sentinel LGAs, ranging from 0.73 in Gabasawa (a mostly rural LGA) to 0.30 in Nassarawa (a highly urban LGA).
Across the three sentinel LGAs, approximately half (49.7%) of all households had at least one child under two years of age, with 36.9% reporting a child aged 6–23 months and 24.1% reporting a child aged 12–23 months. As shown in Table 4.2, the age-group distributions vary considerably across the LGAs: Gabasawa and Gaya show higher concentrations of young children, with 72.8% and 64.7% of households reporting at least one child under two, respectively, compared to just 29.9% in Nassarawa. These differences reflect underlying demographic patterns and fertility levels that influence household composition and program reach.
Proportion of HH with Children 0-23 months | Proportion of HH with Children 6-23 months | Proportion of HH with Children 12-23 months | Sample Sizea | |||||||
|---|---|---|---|---|---|---|---|---|---|---|
Estimate | MOE | DEFF | Estimate | MOE | DEFF | Estimate | MOE | DEFF | ||
Sentinel | 49.7% | ±2.0 | 6.9 | 36.9% | ±1.6 | 5.6 | 24.1% | ±1.3 | 5.2 | 30,142 |
Gabasawa | 72.7% | ±4.4 | 9.6 | 53.9% | ±3.4 | 7.2 | 34.2% | ±2.5 | 5.5 | 10,688 |
Gaya | 64.6% | ±2.5 | 3.3 | 48.5% | ±2.3 | 3.3 | 31.3% | ±1.9 | 3.4 | 10,523 |
Nassarawa | 29.9% | ±1.1 | 1.0 | 21.9% | ±0.9 | 0.9 | 15.0% | ±0.8 | 1.0 | 8,931 |
Non-sentinel | 56.0% | ±3.6 | 12.5 | 41.2% | ±2.4 | 6.8 | 26.6% | ±1.1 | 2.1 | 16,353 |
Gezawa | 70.4% | ±11.2 | 4.4 | 53.5% | ±10.6 | 4.7 | 36.7% | ±7.9 | 3.5 | 815 |
Kiru | 70.3% | ±4.5 | 1.2 | 53.9% | ±4.8 | 1.5 | 37.9% | ±2.9 | 0.8 | 1,447 |
Tudun Wada | 67.9% | ±3.9 | 1.2 | 49.7% | ±2.9 | 0.8 | 31.0% | ±2.0 | 0.4 | 1,387 |
Takai | 67.8% | ±5.6 | 1.7 | 49.5% | ±4.4 | 1.2 | 32.6% | ±2.6 | 0.6 | 1,060 |
Bebeji | 65.7% | ±5.6 | 1.7 | 50.2% | ±4.8 | 1.6 | 30.2% | ±4.0 | 1.6 | 1,022 |
Sumaila | 62.5% | ±4.9 | 2.4 | 44.2% | ±3.9 | 1.7 | 29.6% | ±2.7 | 1.2 | 1,666 |
Dawakin Tofa | 58.7% | ±5.1 | 1.8 | 42.8% | ±3.5 | 1.0 | 26.2% | ±2.7 | 0.9 | 1,072 |
Dawakin Kudu | 56.1% | ±5.2 | 2.4 | 39.6% | ±4.0 | 1.8 | 24.7% | ±3.6 | 2.1 | 1,361 |
Dambatta | 52.9% | ±10.6 | 8.6 | 36.5% | ±5.9 | 3.7 | 24.4% | ±4.8 | 3.4 | 1,223 |
Ungogo | 45.2% | ±4.6 | 2.7 | 33.1% | ±2.3 | 0.8 | 20.4% | ±1.5 | 0.5 | 1,733 |
Kumbotso | 37.5% | ±2.9 | 2.2 | 28.9% | ±2.3 | 1.7 | 18.4% | ±1.8 | 1.5 | 2,917 |
Tarauni | 28.6% | ±7.0 | 3.4 | 21.8% | ±6.3 | 3.6 | 14.1% | ±4.4 | 2.5 | 650 |
All 15 LGAs | 54.9% | ±3.3 | 29.3 | 40.4% | ±2.2 | 16.5 | 26.1% | ±1.1 | 5.6 | 46,495 |
Abbreviations: MOE = Margin of Error; DEFF = Design Effect; HH = Household | ||||||||||
aSample size of households answering the screening question upon initial contact | ||||||||||
Table 4.3 presents household estimates across 15 target LGAs in Kano. The three sentinel LGAs collectively represent an estimated 389,200 households, accounting for only 18% of the total household population across the study area. In contrast, the 12 non-sentinel LGAs represent the remaining 1.7 million households, underscoring the concentration of population outside the sentinel sites.
The margin of error is low in the sentinel areas due both to the high sample size and the relatively direct sampling mechanism. In contrast, the non-sentinel LGAs show greater uncertainty and variability, reflected in a higher Coefficient of Variation (CV) (2.5%) and a Design Effect (DEFF) of 9.6. These elevated DEFFs in non-sentinel LGAs stem from two main factors: the use of cluster-based sampling (as opposed to direct stratified sampling of buildings in sentinel LGAs), and the presence of higher-density housing structures in some areas–particularly apartment buildings–which can increase within-cluster homogeneity.
Number of Households ('000) | Mean HH per Building | Sample | |||||
|---|---|---|---|---|---|---|---|
Estimate | MOE | CV | DEFF | Estimateb | MOE | ||
Sentinel | 389.8 | ±4.4 | 0.6% | 1.0 | 0.93 | ±0.01 | 45,770 |
Nassarawa | 188.2 | ±3.7 | 1.0% | 1.0 | 0.85 | ±0.02 | 15,257 |
Gaya | 108.0 | ±2.0 | 1.0% | 0.9 | 1.05 | ±0.02 | 15,256 |
Gabasawa | 93.6 | ±1.6 | 0.9% | 1.0 | 1.01 | ±0.02 | 15,257 |
Non-sentinel | 1,772.4 | ±85.5 | 2.5% | 9.6 | 0.89 | ±0.04 | 27,602 |
Ungogo | 289.3 | ±45.6 | 8.0% | 22.9 | 0.76 | ±0.12 | 3,149 |
Kumbotso | 223.3 | ±15.5 | 3.5% | 8.5 | 0.68 | ±0.05 | 5,748 |
Tudun Wada | 193.0 | ±37.2 | 9.8% | 7.6 | 1.46 | ±0.28 | 1,911 |
Gezawa | 170.1 | ±18.0 | 5.4% | 2.9 | 1.05 | ±0.11 | 1,287 |
Sumaila | 153.8 | ±34.7 | 11.5% | 15.0 | 0.99 | ±0.22 | 2,556 |
Dawakin Kudu | 134.2 | ±19.8 | 7.5% | 7.2 | 0.91 | ±0.13 | 2,196 |
Dawakin Tofa | 131.6 | ±24.7 | 9.6% | 13.0 | 0.93 | ±0.17 | 1,951 |
Takai | 121.4 | ±19.8 | 8.3% | 6.1 | 1.00 | ±0.16 | 1,628 |
Kiru | 93.8 | ±12.2 | 6.6% | 5.6 | 0.84 | ±0.11 | 2,283 |
Dambatta | 89.1 | ±14.0 | 8.0% | 8.3 | 0.76 | ±0.12 | 1,976 |
Tarauni | 88.0 | ±13.7 | 7.9% | 6.8 | 0.91 | ±0.14 | 1,404 |
Bebeji | 84.9 | ±14.6 | 8.8% | 6.5 | 0.88 | ±0.15 | 1,513 |
All 15 LGAs | 2,162.2 | ±85.6 | 2.0% | 17.6 | 0.90 | ±0.04 | 73,372 |
Abbreviations: MOE = Margin of Error; CV = Coefficient of Variation; DEFF = Design Effect | |||||||
aSample size of building footprints visited by the field team | |||||||
bAverages include non-residential buildings with zero households | |||||||
4.1.2 Infant Characteristics
This section tabulates background characteristics of infants 0-23 months in the 15 LGAs covered by the study.
Proportion | MOE (Prop) | 95% CI | LCB | UCB | DEFF | Estimated Total | MOE (Total) | Unweighted Cases | |
|---|---|---|---|---|---|---|---|---|---|
Boys | 51.2% | ±1.4 | (49.8; 52.7) | 50.0% | 52.5% | 4.97 | 659,943 | ±34,540 | 11,522 |
Girls | 48.8% | ±1.4 | (47.3; 50.2) | 47.5% | 50.0% | 4.97 | 628,081 | ±39,946 | 11,347 |
All | 100.0% | 100.0% | 100.0% | 1,288,024 | ±64,766 | 22,869 | |||
Abbreviations: CI = Confidence Interval; MOE = Margin of Error; LCB = Lower Confidence Bound; UCB = Upper Confidence Bound; DEFF = Design Effect; Domain sample size = 22,869 | |||||||||
Proportion | MOE (Prop) | 95% CI | LCB | UCB | DEFF | Estimated Total | MOE (Total) | Unweighted Cases | |
|---|---|---|---|---|---|---|---|---|---|
1 | 59.5% | ±2.4 | (57.1; 61.9) | 57.5% | 61.5% | 13.28 | 725,597 | ±48,450 | 12,856 |
2 | 9.6% | ±0.9 | (8.7; 10.6) | 8.8% | 10.4% | 5.83 | 116,558 | ±13,107 | 2,083 |
3 | 6.7% | ±0.8 | (6.0; 7.5) | 6.1% | 7.4% | 5.05 | 82,157 | ±9,308 | 1,609 |
4 | 5.9% | ±0.6 | (5.3; 6.6) | 5.4% | 6.4% | 4.20 | 71,616 | ±8,672 | 1,339 |
5 | 5.3% | ±0.6 | (4.7; 6.0) | 4.8% | 5.9% | 4.12 | 64,921 | ±7,604 | 1,138 |
6+ | 13.0% | ±1.1 | (11.9; 14.1) | 12.0% | 13.9% | 6.42 | 158,004 | ±16,051 | 2,607 |
All | 100.0% | 100.0% | 100.0% | 1,218,853 | ±61,211 | 21,632 | |||
Abbreviations: CI = Confidence Interval; MOE = Margin of Error; LCB = Lower Confidence Bound; UCB = Upper Confidence Bound; DEFF = Design Effect; Domain sample size = 21,632 | |||||||||
Proportion | MOE (Prop) | 95% CI | LCB | UCB | DEFF | Estimated Total | MOE (Total) | Unweighted Cases | Domain Sample Size | |
|---|---|---|---|---|---|---|---|---|---|---|
Gabasawa | 0.8% | ±0.2 | (0.6; 1.1) | 0.6% | 1.0% | 1.15 | 603 | ±172 | 58 | 6,677 |
Nassarawa | 0.7% | ±0.4 | (0.4; 1.3) | 0.4% | 1.1% | 1.54 | 452 | ±259 | 16 | 2,554 |
Non-sentinel LGAs | 0.7% | ±0.3 | (0.4; 1.0) | 0.5% | 0.9% | 1.96 | 7,075 | ±2,690 | 49 | 7,520 |
Gaya | 0.5% | ±0.2 | (0.3; 0.6) | 0.3% | 0.6% | 0.89 | 337 | ±119 | 33 | 6,118 |
All | 0.7% | ±0.2 | (0.5; 0.9) | 0.5% | 0.9% | 4.23 | 8,466 | ±2,706 | 156 | 22,869 |
Abbreviations: CI = Confidence Interval; MOE = Margin of Error; LCB = Lower Confidence Bound; UCB = Upper Confidence Bound; DEFF = Design Effect; Pearson's Chi-square test with a Rao & Scott adjustment: F = 1.489 (p=0.172) | ||||||||||
Proportion | MOE (Prop) | 95% CI | LCB | UCB | DEFF | Estimated Total | MOE (Total) | Unweighted Cases | |
|---|---|---|---|---|---|---|---|---|---|
Physical disabilities | 60.8% | ±13.1 | (47.3; 72.9) | 49.5% | 71.1% | 2.88 | 5,149 | ±1,853 | 91 |
Other | 22.1% | ±11.1 | (13.0; 35.1) | 14.2% | 32.8% | 2.86 | 1,875 | ±1,070 | 35 |
Visual impairment | ** | ** | ** | ** | ** | 2.82 | 1,210 | ±945 | 22 |
Hearing impairment | ** | ** | ** | ** | ** | 1.87 | 330 | ±394 | 7 |
Refuse to answer | 0.2% | ±0.4 | (0.0; 1.5) | 0.1% | 1.1% | 0.32 | 20 | ±36 | 2 |
Don't know | 0.2% | ±0.2 | (0.1; 0.7) | 0.1% | 0.6% | 0.13 | 16 | ±19 | 2 |
Abbreviations: CI = Confidence Interval; MOE = Margin of Error; LCB = Lower Confidence Bound; UCB = Upper Confidence Bound; DEFF = Design Effect; Domain sample size = 156; Potentially unreliable values have been suppressed and marked with asterisks (reason(s): The absolute CI width is ≥5% and the relative CI width is ≥130%); Note: Because answers follow a select-multiple format, proportions in this table do not necessarily sum to 100% | |||||||||
Proportion | MOE (Prop) | 95% CI | LCB | UCB | DEFF | Estimated Total | MOE (Total) | Unweighted Cases | Domain Sample Size | |
|---|---|---|---|---|---|---|---|---|---|---|
Nassarawa | 5.1% | ±1.2 | (4.0; 6.5) | 4.2% | 6.3% | 2.11 | 3,245 | ±813 | 125 | 2,554 |
Non-sentinel LGAs | 4.1% | ±0.8 | (3.3; 5.0) | 3.5% | 4.8% | 3.29 | 43,970 | ±8,951 | 308 | 7,520 |
Gabasawa | 4.0% | ±0.7 | (3.4; 4.8) | 3.4% | 4.6% | 2.24 | 2,941 | ±531 | 270 | 6,677 |
Gaya | 3.7% | ±0.6 | (3.1; 4.4) | 3.2% | 4.3% | 1.79 | 2,767 | ±488 | 210 | 6,118 |
All | 4.1% | ±0.7 | (3.5; 4.9) | 3.6% | 4.7% | 7.16 | 52,923 | ±9,095 | 913 | 22,869 |
Abbreviations: CI = Confidence Interval; MOE = Margin of Error; LCB = Lower Confidence Bound; UCB = Upper Confidence Bound; DEFF = Design Effect; Pearson's Chi-square test with a Rao & Scott adjustment: F = 1.178 (p=0.309) | ||||||||||
Proportion | MOE (Prop) | 95% CI | LCB | UCB | DEFF | Estimated Total | MOE (Total) | Unweighted Cases | Domain Sample Size | |
|---|---|---|---|---|---|---|---|---|---|---|
Nassarawa | 59.2% | ±2.2 | (57.0; 61.4) | 57.4% | 61.0% | 1.31 | 37,494 | ±1,996 | 1,519 | 2,554 |
Gaya | 32.7% | ±1.6 | (31.2; 34.3) | 31.4% | 34.1% | 1.80 | 24,246 | ±1,354 | 2,021 | 6,118 |
Non-sentinel LGAs | 27.3% | ±2.1 | (25.2; 29.4) | 25.6% | 29.1% | 4.31 | 293,954 | ±25,553 | 2,354 | 7,520 |
Gabasawa | 26.8% | ±1.3 | (25.5; 28.2) | 25.7% | 28.0% | 1.54 | 19,728 | ±1,060 | 1,949 | 6,677 |
All | 29.1% | ±1.8 | (27.4; 31.0) | 27.7% | 30.7% | 9.12 | 375,422 | ±25,750 | 7,843 | 22,869 |
Abbreviations: CI = Confidence Interval; MOE = Margin of Error; LCB = Lower Confidence Bound; UCB = Upper Confidence Bound; DEFF = Design Effect; Pearson's Chi-square test with a Rao & Scott adjustment: F = 99.622 (p<0.001) | ||||||||||
Proportion | MOE (Prop) | 95% CI | LCB | UCB | DEFF | Estimated Total | MOE (Total) | Unweighted Cases | |
|---|---|---|---|---|---|---|---|---|---|
Home | 78.5% | ±1.5 | (77.0; 79.9) | 77.2% | 79.7% | 7.54 | 1,010,697 | ±58,396 | 17,854 |
Public Health facility | 18.0% | ±1.4 | (16.6; 19.4) | 16.8% | 19.1% | 7.52 | 231,424 | ±19,181 | 4,374 |
Private health facility | 3.2% | ±0.5 | (2.7; 3.8) | 2.8% | 3.7% | 5.41 | 41,104 | ±6,828 | 569 |
Other | 0.4% | ±0.2 | (0.2; 0.6) | 0.3% | 0.5% | 3.97 | 4,800 | ±2,034 | 72 |
All | 100.0% | 100.0% | 100.0% | 1,288,024 | ±64,766 | 22,869 | |||
Abbreviations: CI = Confidence Interval; MOE = Margin of Error; LCB = Lower Confidence Bound; UCB = Upper Confidence Bound; DEFF = Design Effect; Domain sample size = 22,869 | |||||||||
Proportion | MOE (Prop) | 95% CI | LCB | UCB | DEFF | Estimated Total | MOE (Total) | Unweighted Cases | Domain Sample Size | |
|---|---|---|---|---|---|---|---|---|---|---|
Nassarawa | 57.7% | ±2.0 | (55.7; 59.7) | 56.0% | 59.4% | 1.12 | 36,551 | ±2,035 | 1,465 | 2,554 |
Non-sentinel LGAs | 20.0% | ±1.7 | (18.3; 21.8) | 18.6% | 21.5% | 3.64 | 215,561 | ±20,447 | 1,659 | 7,520 |
Gaya | 15.5% | ±1.0 | (14.5; 16.6) | 14.7% | 16.4% | 1.32 | 11,498 | ±815 | 965 | 6,118 |
Gabasawa | 12.7% | ±0.9 | (11.8; 13.6) | 11.9% | 13.5% | 1.30 | 9,318 | ±713 | 864 | 6,677 |
All | 21.2% | ±1.5 | (19.8; 22.7) | 20.0% | 22.4% | 7.59 | 272,928 | ±20,485 | 4,953 | 22,869 |
Abbreviations: CI = Confidence Interval; MOE = Margin of Error; LCB = Lower Confidence Bound; UCB = Upper Confidence Bound; DEFF = Design Effect; Pearson's Chi-square test with a Rao & Scott adjustment: F = 397.12 (p<0.001) | ||||||||||
Proportion | MOE (Prop) | 95% CI | LCB | UCB | DEFF | Estimated Total | MOE (Total) | Unweighted Cases | |
|---|---|---|---|---|---|---|---|---|---|
Public Health facility | 94.5% | ±1.0 | (93.3; 95.4) | 93.5% | 95.3% | 8.40 | 872,897 | ±45,789 | 14,889 |
Other | 4.3% | ±1.0 | (3.5; 5.4) | 3.6% | 5.3% | 9.46 | 40,093 | ±9,765 | 373 |
Private health facility | 1.2% | ±0.3 | (0.9; 1.6) | 0.9% | 1.5% | 3.78 | 10,869 | ±3,100 | 200 |
All | 100.0% | 100.0% | 100.0% | 923,859 | ±48,899 | 15,462 | |||
Abbreviations: CI = Confidence Interval; MOE = Margin of Error; LCB = Lower Confidence Bound; UCB = Upper Confidence Bound; DEFF = Design Effect; Domain sample size = 15,462 | |||||||||
4.1.3 Caregiver Characteristics
This section tabulates background characteristics of the caregivers of infants 0-23 months in the 15 LGAs covered by the study.
Proportion | MOE (Prop) | 95% CI | LCB | UCB | DEFF | Estimated Total | MOE (Total) | Unweighted Cases | |
|---|---|---|---|---|---|---|---|---|---|
Female | 98.2% | ±0.4 | (97.7; 98.5) | 97.8% | 98.4% | 3.87 | 1,084,914 | ±83,860 | 18,859 |
Male | 1.8% | ±0.4 | (1.5; 2.3) | 1.6% | 2.2% | 3.87 | 20,438 | ±4,459 | 512 |
All | 100.0% | 100.0% | 1,105,353 | ±85,311 | 19,371 | ||||
Abbreviations: CI = Confidence Interval; MOE = Margin of Error; LCB = Lower Confidence Bound; UCB = Upper Confidence Bound; DEFF = Design Effect; Domain sample size = 19,371 | |||||||||
Proportion | MOE (Prop) | 95% CI | LCB | UCB | DEFF | Estimated Total | MOE (Total) | Unweighted Cases | |
|---|---|---|---|---|---|---|---|---|---|
Mother | 90.6% | ±1.8 | (88.6; 92.3) | 89.0% | 92.1% | 23.45 | 1,165,299 | ±52,410 | 20,836 |
Other | 7.3% | ±1.9 | (5.6; 9.4) | 5.8% | 9.0% | 30.95 | 93,480 | ±27,148 | 1,375 |
Grandparent | 1.2% | ±0.2 | (0.9; 1.4) | 1.0% | 1.4% | 2.87 | 14,813 | ±3,008 | 348 |
Father | 1.0% | ±0.3 | (0.7; 1.3) | 0.8% | 1.2% | 4.36 | 12,284 | ±3,397 | 252 |
Refuse to answer | 2,149 | ±1,011 | 58 | ||||||
All | 100.0% | 100.0% | 100.0% | 1,288,024 | ±64,766 | 22,869 | |||
Abbreviations: CI = Confidence Interval; MOE = Margin of Error; LCB = Lower Confidence Bound; UCB = Upper Confidence Bound; DEFF = Design Effect; Domain sample size = 22,869 | |||||||||
Proportion | MOE (Prop) | 95% CI | LCB | UCB | DEFF | Estimated Total | MOE (Total) | Unweighted Cases | Domain Sample Size | |
|---|---|---|---|---|---|---|---|---|---|---|
Nassarawa | 93.8% | ±1.1 | (92.5; 94.8) | 92.7% | 94.7% | 1.48 | 59,374 | ±2,579 | 2,401 | 2,554 |
Non-sentinel LGAs | 90.4% | ±2.2 | (87.9; 92.3) | 88.4% | 92.1% | 10.81 | 973,290 | ±52,431 | 6,872 | 7,520 |
Gaya | 90.3% | ±1.0 | (89.2; 91.2) | 89.4% | 91.1% | 1.82 | 66,885 | ±2,033 | 5,535 | 6,118 |
Gabasawa | 89.4% | ±1.0 | (88.4; 90.4) | 88.6% | 90.3% | 1.92 | 65,750 | ±1,911 | 6,028 | 6,677 |
All | 90.5% | ±1.8 | (88.5; 92.2) | 88.8% | 91.9% | 23.25 | 1,165,299 | ±52,410 | 20,836 | 22,869 |
Abbreviations: CI = Confidence Interval; MOE = Margin of Error; LCB = Lower Confidence Bound; UCB = Upper Confidence Bound; DEFF = Design Effect; Pearson's Chi-square test with a Rao & Scott adjustment: F = 2.732 (p=0.085) | ||||||||||
Proportion | MOE (Prop) | 95% CI | LCB | UCB | DEFF | Estimated Total | MOE (Total) | Unweighted Cases | |
|---|---|---|---|---|---|---|---|---|---|
Married | 97.9% | ±0.4 | (97.5; 98.3) | 97.6% | 98.2% | 3.80 | 1,082,559 | ±84,150 | 19,006 |
Divorced | 1.0% | ±0.3 | (0.7; 1.3) | 0.8% | 1.2% | 3.83 | 10,752 | ±3,251 | 176 |
Widowed | 0.4% | ±0.2 | (0.3; 0.6) | 0.3% | 0.6% | 2.74 | 4,820 | ±2,052 | 80 |
Never married | 0.4% | ±0.2 | (0.2; 0.6) | 0.3% | 0.5% | 3.98 | 4,104 | ±2,295 | 67 |
Separated | 0.2% | ±0.1 | (0.1; 0.4) | 0.1% | 0.4% | 4.01 | 2,469 | ±1,823 | 26 |
Other | 0.1% | ±0.0 | (0.0; 0.1) | 0.0% | 0.1% | 1.70 | 650 | ±672 | 16 |
All | 100.0% | 100.0% | 1,105,353 | ±85,311 | 19,371 | ||||
Abbreviations: CI = Confidence Interval; MOE = Margin of Error; LCB = Lower Confidence Bound; UCB = Upper Confidence Bound; DEFF = Design Effect; Domain sample size = 19,371 | |||||||||
Proportion | MOE (Prop) | 95% CI | LCB | UCB | DEFF | Estimated Total | MOE (Total) | Unweighted Cases | |
|---|---|---|---|---|---|---|---|---|---|
< 18 | 1.0% | ±0.3 | (0.7; 1.2) | 0.8% | 1.2% | 2.91 | 9,458 | ±2,477 | 230 |
18-20 | 18.5% | ±1.3 | (17.2; 19.8) | 17.4% | 19.6% | 4.76 | 182,971 | ±20,077 | 3,248 |
21-25 | 28.2% | ±1.5 | (26.7; 29.7) | 26.9% | 29.5% | 4.93 | 278,974 | ±26,770 | 4,556 |
26-30 | 26.0% | ±1.2 | (24.8; 27.2) | 25.0% | 27.0% | 3.31 | 257,401 | ±22,442 | 4,570 |
31-35 | 13.1% | ±1.0 | (12.1; 14.1) | 12.3% | 13.9% | 3.85 | 129,328 | ±14,325 | 2,083 |
36-40 | 8.9% | ±0.8 | (8.2; 9.8) | 8.3% | 9.6% | 3.57 | 88,484 | ±10,553 | 1,516 |
above 40 | 4.4% | ±0.7 | (3.7; 5.1) | 3.8% | 5.0% | 4.72 | 43,240 | ±7,685 | 694 |
Refusal or don't know | 115,495 | ±18,104 | 2,474 | ||||||
All | 100.0% | 100.0% | 100.0% | 1,105,353 | ±85,311 | 19,371 | |||
Abbreviations: CI = Confidence Interval; MOE = Margin of Error; LCB = Lower Confidence Bound; UCB = Upper Confidence Bound; DEFF = Design Effect; Domain sample size = 19,371 | |||||||||
Proportion | MOE (Prop) | 95% CI | LCB | UCB | DEFF | Estimated Total | MOE (Total) | Unweighted Cases | Domain Sample Size | |
|---|---|---|---|---|---|---|---|---|---|---|
Gabasawa | 94.4% | ±0.7 | (93.7; 95.0) | 93.8% | 94.9% | 1.19 | 55,403 | ±993 | 5,110 | 5,438 |
Gaya | 94.4% | ±0.8 | (93.6; 95.1) | 93.7% | 95.0% | 1.40 | 56,569 | ±1,002 | 4,723 | 4,993 |
Non-sentinel LGAs | 90.6% | ±1.6 | (89.0; 92.1) | 89.2% | 91.9% | 4.84 | 841,792 | ±79,481 | 5,938 | 6,597 |
Nassarawa | 75.0% | ±1.9 | (73.1; 76.9) | 73.4% | 76.6% | 1.21 | 43,450 | ±1,398 | 1,769 | 2,343 |
All | 90.2% | ±1.3 | (88.8; 91.4) | 89.1% | 91.3% | 9.75 | 997,214 | ±79,161 | 17,540 | 19,371 |
Abbreviations: CI = Confidence Interval; MOE = Margin of Error; LCB = Lower Confidence Bound; UCB = Upper Confidence Bound; DEFF = Design Effect; Pearson's Chi-square test with a Rao & Scott adjustment: F = 34.276 (p<0.001) | ||||||||||
Proportion | MOE (Prop) | 95% CI | LCB | UCB | DEFF | Estimated Total | MOE (Total) | Unweighted Cases | Domain Sample Size | |
|---|---|---|---|---|---|---|---|---|---|---|
Nassarawa | 77.6% | ±1.9 | (75.7; 79.5) | 76.0% | 79.2% | 1.29 | 44,951 | ±1,323 | 1,836 | 2,343 |
Non-sentinel LGAs | 40.5% | ±3.8 | (36.7; 44.3) | 37.3% | 43.7% | 10.28 | 376,010 | ±44,291 | 2,913 | 6,597 |
Gabasawa | 26.0% | ±1.3 | (24.7; 27.3) | 24.9% | 27.0% | 1.19 | 15,239 | ±761 | 1,507 | 5,438 |
Gaya | 21.6% | ±1.2 | (20.4; 22.8) | 20.6% | 22.6% | 1.18 | 12,934 | ±768 | 1,096 | 4,993 |
All | 40.6% | ±3.2 | (37.5; 43.9) | 38.0% | 43.3% | 21.38 | 449,133 | ±44,132 | 7,352 | 19,371 |
Abbreviations: CI = Confidence Interval; MOE = Margin of Error; LCB = Lower Confidence Bound; UCB = Upper Confidence Bound; DEFF = Design Effect; Pearson's Chi-square test with a Rao & Scott adjustment: F = 143.951 (p<0.001) | ||||||||||
Proportion | MOE (Prop) | 95% CI | LCB | UCB | DEFF | Estimated Total | MOE (Total) | Unweighted Cases | |
|---|---|---|---|---|---|---|---|---|---|
No education | 62.6% | ±3.3 | (59.3; 65.8) | 59.8% | 65.3% | 23.13 | 692,085 | ±70,807 | 12,662 |
Primary | 9.6% | ±1.0 | (8.6; 10.7) | 8.7% | 10.5% | 6.18 | 105,841 | ±12,969 | 1,901 |
Secondary | 24.0% | ±2.8 | (21.3; 27.0) | 21.7% | 26.5% | 22.21 | 265,770 | ±35,363 | 4,106 |
More than secondary | 3.8% | ±0.6 | (3.2; 4.4) | 3.3% | 4.3% | 5.21 | 41,657 | ±6,628 | 702 |
All | 100.0% | 100.0% | 1,105,353 | ±85,311 | 19,371 | ||||
Abbreviations: CI = Confidence Interval; MOE = Margin of Error; LCB = Lower Confidence Bound; UCB = Upper Confidence Bound; DEFF = Design Effect; Domain sample size = 19,371 | |||||||||
Proportion | MOE (Prop) | 95% CI | LCB | UCB | DEFF | Estimated Total | MOE (Total) | Unweighted Cases | Domain Sample Size | |
|---|---|---|---|---|---|---|---|---|---|---|
Nassarawa | 76.4% | ±1.9 | (74.4; 78.2) | 74.7% | 77.9% | 1.21 | 44,213 | ±1,377 | 1,787 | 2,343 |
Non-sentinel LGAs | 36.5% | ±3.7 | (32.9; 40.3) | 33.5% | 39.7% | 10.04 | 339,452 | ±41,263 | 2,639 | 6,597 |
Gaya | 18.1% | ±1.1 | (17.0; 19.3) | 17.2% | 19.1% | 1.13 | 10,847 | ±696 | 941 | 4,993 |
Gabasawa | 18.1% | ±1.1 | (17.0; 19.2) | 17.2% | 19.1% | 1.19 | 10,622 | ±667 | 1,033 | 5,438 |
All | 36.7% | ±3.1 | (33.6; 39.8) | 34.1% | 39.3% | 20.86 | 405,134 | ±41,118 | 6,400 | 19,371 |
Abbreviations: CI = Confidence Interval; MOE = Margin of Error; LCB = Lower Confidence Bound; UCB = Upper Confidence Bound; DEFF = Design Effect; Pearson's Chi-square test with a Rao & Scott adjustment: F = 262.216 (p<0.001) | ||||||||||
Proportion | MOE (Prop) | 95% CI | LCB | UCB | DEFF | Estimated Total | MOE (Total) | Unweighted Cases | |
|---|---|---|---|---|---|---|---|---|---|
Unemployed | 54.2% | ±2.1 | (52.1; 56.3) | 52.5% | 56.0% | 8.88 | 599,338 | ±51,566 | 11,241 |
Self-employed | 40.8% | ±2.2 | (38.6; 42.9) | 39.0% | 42.6% | 9.83 | 450,539 | ±43,177 | 7,168 |
Other: ____ | 3.2% | ±1.1 | (2.3; 4.5) | 2.5% | 4.3% | 18.45 | 35,791 | ±12,685 | 538 |
Employed full-time | 0.8% | ±0.2 | (0.6; 1.0) | 0.7% | 1.0% | 2.03 | 8,798 | ±2,029 | 210 |
Student | 0.4% | ±0.2 | (0.3; 0.6) | 0.3% | 0.6% | 3.05 | 4,445 | ±1,416 | 92 |
Employed part-time | 0.4% | ±0.1 | (0.3; 0.5) | 0.3% | 0.5% | 2.36 | 4,144 | ±1,675 | 100 |
Retired | 0.2% | ±0.1 | (0.1; 0.4) | 0.1% | 0.4% | 4.43 | 2,297 | ±1,681 | 22 |
All | 100.0% | 100.0% | 1,105,353 | ±85,311 | 19,371 | ||||
Abbreviations: CI = Confidence Interval; MOE = Margin of Error; LCB = Lower Confidence Bound; UCB = Upper Confidence Bound; DEFF = Design Effect; Domain sample size = 19,371 | |||||||||
Proportion | MOE (Prop) | 95% CI | LCB | UCB | DEFF | Estimated Total | MOE (Total) | Unweighted Cases | |
|---|---|---|---|---|---|---|---|---|---|
Hausa | 82.7% | ±2.2 | (80.4; 84.8) | 80.8% | 84.5% | 17.36 | 914,074 | ±77,959 | 15,288 |
Fulani | 14.8% | ±2.2 | (12.8; 17.1) | 13.1% | 16.8% | 19.21 | 163,701 | ±26,261 | 3,638 |
Other | 1.3% | ±0.3 | (1.0; 1.7) | 1.1% | 1.7% | 4.39 | 14,759 | ±4,465 | 237 |
Kanuri | 0.9% | ±0.2 | (0.7; 1.2) | 0.7% | 1.2% | 3.38 | 10,314 | ±3,507 | 157 |
Yoruba | 0.1% | ±0.1 | (0.1; 0.2) | 0.1% | 0.2% | 1.50 | 1,190 | ±474 | 25 |
Igbo | 0.0% | ±0.0 | (0.0; 0.1) | 0.0% | 0.1% | 2.51 | 482 | ±214 | 9 |
Nupe | 0.0% | ±0.0 | (0.0; 0.1) | 0.0% | 0.1% | 2.25 | 432 | 5 | |
Refuse to answer | 401 | ±94 | 12 | ||||||
All | 100.0% | 100.0% | 100.0% | 1,105,353 | ±85,311 | 19,371 | |||
Abbreviations: CI = Confidence Interval; MOE = Margin of Error; LCB = Lower Confidence Bound; UCB = Upper Confidence Bound; DEFF = Design Effect; Domain sample size = 19,371 | |||||||||
Proportion | MOE (Prop) | 95% CI | LCB | UCB | DEFF | Estimated Total | MOE (Total) | Unweighted Cases | |
|---|---|---|---|---|---|---|---|---|---|
Islam | 98.9% | ±0.7 | (97.9; 99.4) | 98.1% | 99.4% | 24.12 | 1,092,510 | ±85,812 | 19,204 |
Other Christian | 0.6% | ±0.4 | (0.4; 1.1) | 0.4% | 1.0% | 10.75 | 7,035 | ±5,041 | 97 |
Catholic | 0.4% | ±0.4 | (0.2; 1.1) | 0.2% | 1.0% | 19.70 | 4,828 | ±8,888 | 50 |
Other | 0.0% | ±0.0 | (0.0; 0.1) | 0.0% | 0.1% | 2.12 | 265 | 5 | |
Traditionalist | 0.0% | ±0.0 | (0.0; 0.1) | 0.0% | 0.0% | 1.37 | 126 | ±332 | 4 |
Refuse to answer | 589 | ±66 | 11 | ||||||
All | 100.0% | 100.0% | 100.0% | 1,105,353 | ±85,311 | 19,371 | |||
Abbreviations: CI = Confidence Interval; MOE = Margin of Error; LCB = Lower Confidence Bound; UCB = Upper Confidence Bound; DEFF = Design Effect; Domain sample size = 19,371 | |||||||||
Proportion | MOE (Prop) | 95% CI | LCB | UCB | DEFF | Estimated Total | MOE (Total) | Unweighted Cases | Domain Sample Size | |
|---|---|---|---|---|---|---|---|---|---|---|
Gabasawa | 99.9% | ±0.1 | (99.8; 99.9) | 99.8% | 99.9% | 0.71 | 58,622 | ±946 | 5,429 | 5,438 |
Gaya | 99.9% | ±0.1 | (99.8; 99.9) | 99.8% | 99.9% | 0.81 | 59,853 | ±960 | 4,986 | 4,993 |
Non-sentinel LGAs | 98.9% | ±0.9 | (97.6; 99.5) | 97.9% | 99.4% | 11.31 | 918,321 | ±86,167 | 6,519 | 6,597 |
Nassarawa | 96.2% | ±0.9 | (95.2; 97.1) | 95.4% | 96.9% | 1.48 | 55,714 | ±1,145 | 2,270 | 2,343 |
All | 98.8% | ±0.7 | (97.8; 99.4) | 98.0% | 99.3% | 23.01 | 1,092,510 | ±85,812 | 19,204 | 19,371 |
Abbreviations: CI = Confidence Interval; MOE = Margin of Error; LCB = Lower Confidence Bound; UCB = Upper Confidence Bound; DEFF = Design Effect; Pearson's Chi-square test with a Rao & Scott adjustment: F = 13.987 (p<0.001) | ||||||||||
Proportion | MOE (Prop) | 95% CI | LCB | UCB | DEFF | Estimated Total | MOE (Total) | Unweighted Cases | Domain Sample Size | |
|---|---|---|---|---|---|---|---|---|---|---|
Nassarawa | 37.3% | ±2.2 | (35.1; 39.5) | 35.5% | 39.1% | 1.24 | 21,574 | ±1,349 | 860 | 2,343 |
Non-sentinel LGAs | 12.6% | ±2.1 | (10.7; 14.8) | 11.0% | 14.5% | 6.51 | 117,350 | ±20,650 | 934 | 6,597 |
Gaya | 2.9% | ±0.5 | (2.4; 3.4) | 2.5% | 3.3% | 1.06 | 1,716 | ±312 | 160 | 4,993 |
Gabasawa | 2.3% | ±0.4 | (1.9; 2.8) | 2.0% | 2.7% | 1.24 | 1,348 | ±264 | 131 | 5,438 |
All | 12.8% | ±1.7 | (11.2; 14.7) | 11.5% | 14.4% | 13.40 | 141,987 | ±21,367 | 2,085 | 19,371 |
Abbreviations: CI = Confidence Interval; MOE = Margin of Error; LCB = Lower Confidence Bound; UCB = Upper Confidence Bound; DEFF = Design Effect; Pearson's Chi-square test with a Rao & Scott adjustment: F = 110.673 (p<0.001) | ||||||||||
4.1.4 Household Characteristics
This section tabulates background characteristics of households in the 15 LGAs covered by the study. Unless explicitly mentioned otherwise, statistics pertain to households with infants 0-23 months.
Proportion | MOE (Prop) | 95% CI | LCB | UCB | DEFF | Estimated Total | MOE (Total) | Unweighted Cases | |
|---|---|---|---|---|---|---|---|---|---|
Ungogo | 13.7% | ±2.3 | (11.6; 16.1) | 11.9% | 15.7% | 52.83 | 306,936 | ±56,836 | 1,733 |
Kumbotso | 10.1% | ±0.9 | (9.3; 11.0) | 9.4% | 10.9% | 10.46 | 226,309 | ±18,827 | 2,917 |
Tudun Wada | 9.1% | ±1.7 | (7.5; 11.0) | 7.8% | 10.7% | 43.22 | 204,516 | ±41,032 | 1,387 |
Nassarawa | 8.7% | ±0.4 | (8.3; 9.1) | 8.4% | 9.1% | 2.60 | 194,930 | ±4,785 | 8,931 |
Gezawa | 7.5% | ±0.9 | (6.6; 8.5) | 6.7% | 8.3% | 15.58 | 167,480 | ±21,803 | 815 |
Sumaila | 7.1% | ±1.2 | (6.0; 8.4) | 6.2% | 8.1% | 25.47 | 158,725 | ±27,424 | 1,666 |
Dawakin Tofa | 6.3% | ±1.3 | (5.1; 7.7) | 5.3% | 7.4% | 32.82 | 140,707 | ±29,583 | 1,072 |
Dawakin Kudu | 6.2% | ±0.9 | (5.4; 7.2) | 5.5% | 7.0% | 16.80 | 139,250 | ±20,239 | 1,361 |
Takai | 5.6% | ±0.9 | (4.7; 6.5) | 4.9% | 6.4% | 17.98 | 124,511 | ±20,698 | 1,060 |
Gaya | 5.0% | ±0.2 | (4.7; 5.2) | 4.8% | 5.2% | 1.31 | 111,004 | ±2,157 | 10,523 |
Kiru | 4.5% | ±0.6 | (3.9; 5.1) | 4.0% | 5.0% | 11.30 | 99,690 | ±14,189 | 1,447 |
Gabasawa | 4.3% | ±0.2 | (4.1; 4.6) | 4.2% | 4.5% | 1.28 | 97,390 | ±1,838 | 10,688 |
Dambatta | 4.2% | ±0.7 | (3.6; 5.0) | 3.7% | 4.8% | 14.15 | 94,533 | ±15,589 | 1,223 |
Bebeji | 4.1% | ±0.8 | (3.4; 4.9) | 3.5% | 4.8% | 18.35 | 91,002 | ±17,400 | 1,022 |
Tarauni | 3.7% | ±0.9 | (2.9; 4.6) | 3.0% | 4.5% | 25.20 | 82,028 | ±19,750 | 650 |
All | 100.0% | 100.0% | 100.0% | 2,239,009 | ±95,273 | 46,495 | |||
Abbreviations: CI = Confidence Interval; MOE = Margin of Error; LCB = Lower Confidence Bound; UCB = Upper Confidence Bound; DEFF = Design Effect; Domain sample size = 46,495 | |||||||||
Proportion | MOE (Prop) | 95% CI | LCB | UCB | DEFF | Estimated Total | MOE (Total) | Unweighted Cases | |
|---|---|---|---|---|---|---|---|---|---|
Rural | 54.2% | ±4.1 | (50.1; 58.3) | 50.7% | 57.7% | 82.59 | 1,213,934 | ±109,136 | 26,160 |
Urban | 45.8% | ±4.1 | (41.7; 49.9) | 42.3% | 49.3% | 82.59 | 1,025,075 | ±98,886 | 20,335 |
All | 100.0% | 100.0% | 100.0% | 2,239,009 | ±95,273 | 46,495 | |||
Abbreviations: CI = Confidence Interval; MOE = Margin of Error; LCB = Lower Confidence Bound; UCB = Upper Confidence Bound; DEFF = Design Effect; Domain sample size = 46,495 | |||||||||
Details on the urban and rural classifications can be found in Appendix E.
Proportion | MOE (Prop) | 95% CI | LCB | UCB | DEFF | Estimated Total | MOE (Total) | Unweighted Cases | Domain Sample Size | |
|---|---|---|---|---|---|---|---|---|---|---|
Gabasawa | 94.3% | ±0.9 | (93.3; 95.2) | 93.5% | 95.0% | 4.47 | 91,843 | ±1,975 | 9,992 | 10,688 |
Gaya | 69.8% | ±2.1 | (67.6; 71.9) | 68.0% | 71.6% | 5.96 | 77,511 | ±2,847 | 7,222 | 10,523 |
Non-sentinel LGAs | 56.9% | ±4.9 | (52.0; 61.7) | 52.8% | 60.9% | 41.21 | 1,044,580 | ±106,898 | 8,946 | 16,353 |
Nassarawa | 0.0% | ±0.0 | (0.0; 0.7) | 0.0% | 0.0% | 0 | ±0 | 0 | 8,931 | |
All | 54.2% | ±4.1 | (50.1; 58.3) | 50.7% | 57.7% | 82.59 | 1,213,934 | ±109,136 | 26,160 | 46,495 |
Abbreviations: CI = Confidence Interval; MOE = Margin of Error; LCB = Lower Confidence Bound; UCB = Upper Confidence Bound; DEFF = Design Effect; Pearson's Chi-square test with a Rao & Scott adjustment: F = 207.177 (p<0.001) | ||||||||||
Proportion | MOE (Prop) | 95% CI | LCB | UCB | DEFF | Estimated Total | MOE (Total) | Unweighted Cases | |
|---|---|---|---|---|---|---|---|---|---|
Mostly uninhabited area | 0.6% | ±0.2 | (0.4; 0.9) | 0.5% | 0.9% | 11.28 | 14,142 | ±5,487 | 207 |
Dispersed rural area | 8.1% | ±1.9 | (6.4; 10.2) | 6.6% | 9.8% | 58.95 | 180,860 | ±43,821 | 3,008 |
Village | 4.0% | ±1.5 | (2.8; 5.7) | 3.0% | 5.4% | 65.85 | 89,774 | ±33,008 | 1,485 |
Suburban or peri-urban area | 28.0% | ±3.8 | (24.4; 31.9) | 24.9% | 31.2% | 84.25 | 625,821 | ±89,507 | 13,282 |
Semi-dense town | 5.2% | ±1.5 | (3.9; 6.9) | 4.1% | 6.6% | 52.53 | 116,160 | ±33,563 | 2,822 |
Dense town | 14.0% | ±2.6 | (11.6; 16.7) | 12.0% | 16.3% | 65.31 | 313,348 | ±57,828 | 7,688 |
City | 40.1% | ±5.3 | (35.0; 45.5) | 35.8% | 44.6% | 138.57 | 898,905 | ±119,762 | 18,003 |
All | 100.0% | 100.0% | 100.0% | 2,239,009 | ±95,273 | 46,495 | |||
Abbreviations: CI = Confidence Interval; MOE = Margin of Error; LCB = Lower Confidence Bound; UCB = Upper Confidence Bound; DEFF = Design Effect; Domain sample size = 46,495 | |||||||||
Proportion | MOE (Prop) | 95% CI | LCB | UCB | DEFF | Estimated Total | MOE (Total) | Unweighted Cases | Domain Sample Size | |
|---|---|---|---|---|---|---|---|---|---|---|
Gabasawa | 9.4% | ±0.9 | (8.5; 10.3) | 8.7% | 10.2% | 1.37 | 5,509 | ±539 | 521 | 5,438 |
Gaya | 8.7% | ±0.9 | (7.9; 9.7) | 8.0% | 9.5% | 1.26 | 5,231 | ±530 | 452 | 4,993 |
Non-sentinel LGAs | 8.1% | ±1.0 | (7.1; 9.2) | 7.3% | 9.1% | 2.50 | 75,495 | ±12,719 | 492 | 6,597 |
Nassarawa | 5.3% | ±1.0 | (4.3; 6.4) | 4.5% | 6.2% | 1.31 | 3,058 | ±637 | 119 | 2,343 |
All | 8.1% | ±0.9 | (7.2; 9.0) | 7.4% | 8.8% | 5.27 | 89,294 | ±12,851 | 1,584 | 19,371 |
Abbreviations: CI = Confidence Interval; MOE = Margin of Error; LCB = Lower Confidence Bound; UCB = Upper Confidence Bound; DEFF = Design Effect; Pearson's Chi-square test with a Rao & Scott adjustment: F = 2.793 (p=0.012) | ||||||||||
Proportion | MOE (Prop) | 95% CI | LCB | UCB | DEFF | Estimated Total | MOE (Total) | Unweighted Cases | Domain Sample Size | |
|---|---|---|---|---|---|---|---|---|---|---|
Nassarawa | 87.2% | ±1.5 | (85.7; 88.6) | 85.9% | 88.3% | 1.15 | 50,477 | ±1,304 | 2,037 | 2,343 |
Non-sentinel LGAs | 35.9% | ±5.1 | (31.0; 41.2) | 31.8% | 40.3% | 19.40 | 333,777 | ±49,914 | 2,689 | 6,597 |
Gaya | 22.4% | ±1.2 | (21.2; 23.6) | 21.3% | 23.4% | 1.16 | 13,405 | ±785 | 1,118 | 4,993 |
Gabasawa | 4.0% | ±0.6 | (3.5; 4.7) | 3.5% | 4.5% | 1.29 | 2,356 | ±350 | 225 | 5,438 |
All | 36.2% | ±4.3 | (32.0; 40.6) | 32.7% | 39.9% | 40.23 | 400,015 | ±49,722 | 6,069 | 19,371 |
Abbreviations: CI = Confidence Interval; MOE = Margin of Error; LCB = Lower Confidence Bound; UCB = Upper Confidence Bound; DEFF = Design Effect; Pearson's Chi-square test with a Rao & Scott adjustment: F = 345.619 (p<0.001) | ||||||||||
Proportion | MOE (Prop) | 95% CI | LCB | UCB | DEFF | Estimated Total | MOE (Total) | Unweighted Cases | Domain Sample Size | |
|---|---|---|---|---|---|---|---|---|---|---|
Nassarawa | 61.3% | ±2.2 | (59.1; 63.5) | 59.5% | 63.1% | 1.22 | 35,508 | ±1,402 | 1,443 | 2,343 |
Non-sentinel LGAs | 26.7% | ±2.6 | (24.3; 29.4) | 24.6% | 28.9% | 5.72 | 248,398 | ±31,331 | 1,912 | 6,597 |
Gaya | 17.9% | ±1.2 | (16.8; 19.1) | 16.9% | 18.9% | 1.27 | 10,737 | ±740 | 897 | 4,993 |
Gabasawa | 15.6% | ±1.1 | (14.5; 16.7) | 14.6% | 16.5% | 1.41 | 9,132 | ±695 | 808 | 5,438 |
All | 27.5% | ±2.2 | (25.4; 29.7) | 25.7% | 29.3% | 11.79 | 303,774 | ±31,243 | 5,060 | 19,371 |
Abbreviations: CI = Confidence Interval; MOE = Margin of Error; LCB = Lower Confidence Bound; UCB = Upper Confidence Bound; DEFF = Design Effect; Pearson's Chi-square test with a Rao & Scott adjustment: F = 234.757 (p<0.001) | ||||||||||
Proportion | MOE (Prop) | 95% CI | LCB | UCB | DEFF | Estimated Total | MOE (Total) | Unweighted Cases | Domain Sample Size | |
|---|---|---|---|---|---|---|---|---|---|---|
Nassarawa | 54.0% | ±2.2 | (51.7; 56.2) | 52.1% | 55.8% | 1.20 | 31,241 | ±1,374 | 1,269 | 2,343 |
Non-sentinel LGAs | 13.9% | ±1.8 | (12.1; 15.8) | 12.4% | 15.5% | 4.86 | 128,944 | ±17,318 | 1,128 | 6,597 |
Gaya | 4.4% | ±0.6 | (3.8; 5.1) | 3.9% | 5.0% | 1.18 | 2,644 | ±391 | 230 | 4,993 |
Gabasawa | 2.2% | ±0.5 | (1.7; 2.7) | 1.8% | 2.6% | 1.48 | 1,272 | ±278 | 118 | 5,438 |
All | 14.8% | ±1.6 | (13.3; 16.5) | 13.6% | 16.2% | 9.92 | 164,101 | ±17,514 | 2,745 | 19,371 |
Abbreviations: CI = Confidence Interval; MOE = Margin of Error; LCB = Lower Confidence Bound; UCB = Upper Confidence Bound; DEFF = Design Effect; Pearson's Chi-square test with a Rao & Scott adjustment: F = 547.982 (p<0.001) | ||||||||||
Proportion | MOE (Prop) | 95% CI | LCB | UCB | DEFF | Estimated Total | MOE (Total) | Unweighted Cases | Domain Sample Size | |
|---|---|---|---|---|---|---|---|---|---|---|
Nassarawa | 8.0% | ±1.2 | (6.8; 9.3) | 7.0% | 9.1% | 1.26 | 4,624 | ±723 | 172 | 2,343 |
Non-sentinel LGAs | 3.9% | ±1.1 | (3.0; 5.1) | 3.1% | 4.9% | 4.99 | 36,408 | ±10,481 | 215 | 6,597 |
Gaya | 3.2% | ±0.6 | (2.6; 3.8) | 2.7% | 3.7% | 1.55 | 1,889 | ±408 | 141 | 4,993 |
Gabasawa | 2.5% | ±0.5 | (2.1; 3.1) | 2.2% | 3.0% | 1.25 | 1,495 | ±303 | 137 | 5,438 |
All | 4.0% | ±0.9 | (3.2; 5.0) | 3.3% | 4.8% | 10.20 | 44,416 | ±10,683 | 665 | 19,371 |
Abbreviations: CI = Confidence Interval; MOE = Margin of Error; LCB = Lower Confidence Bound; UCB = Upper Confidence Bound; DEFF = Design Effect; Pearson's Chi-square test with a Rao & Scott adjustment: F = 15.429 (p<0.001) | ||||||||||
Proportion | MOE (Prop) | 95% CI | LCB | UCB | DEFF | Estimated Total | MOE (Total) | Unweighted Cases | Domain Sample Size | |
|---|---|---|---|---|---|---|---|---|---|---|
Nassarawa | 9.6% | ±1.3 | (8.4; 11.0) | 8.6% | 10.7% | 1.13 | 5,572 | ±736 | 230 | 2,343 |
Non-sentinel LGAs | 2.1% | ±0.5 | (1.7; 2.7) | 1.8% | 2.6% | 1.88 | 19,680 | ±4,439 | 183 | 6,597 |
Gabasawa | 0.9% | ±0.3 | (0.6; 1.2) | 0.7% | 1.1% | 1.27 | 509 | ±206 | 49 | 5,438 |
Gaya | 0.7% | ±0.3 | (0.5; 1.1) | 0.6% | 1.0% | 1.32 | 449 | ±191 | 37 | 4,993 |
All | 2.4% | ±0.4 | (2.0; 2.8) | 2.0% | 2.7% | 3.71 | 26,211 | ±4,851 | 499 | 19,371 |
Abbreviations: CI = Confidence Interval; MOE = Margin of Error; LCB = Lower Confidence Bound; UCB = Upper Confidence Bound; DEFF = Design Effect; Pearson's Chi-square test with a Rao & Scott adjustment: F = 128.353 (p<0.001) | ||||||||||
Proportion | MOE (Prop) | 95% CI | LCB | UCB | DEFF | Estimated Total | MOE (Total) | Unweighted Cases | Domain Sample Size | |
|---|---|---|---|---|---|---|---|---|---|---|
Nassarawa | 33.6% | ±2.1 | (31.6; 35.7) | 31.9% | 35.4% | 1.19 | 19,459 | ±1,260 | 778 | 2,343 |
Non-sentinel LGAs | 7.6% | ±1.2 | (6.5; 8.8) | 6.7% | 8.6% | 3.26 | 70,461 | ±10,033 | 652 | 6,597 |
Gaya | 1.8% | ±0.4 | (1.5; 2.3) | 1.5% | 2.2% | 1.02 | 1,101 | ±258 | 107 | 4,993 |
Gabasawa | 0.7% | ±0.3 | (0.5; 1.1) | 0.5% | 1.0% | 1.57 | 427 | ±196 | 42 | 5,438 |
All | 8.3% | ±1.0 | (7.3; 9.3) | 7.5% | 9.2% | 6.64 | 91,449 | ±10,749 | 1,579 | 19,371 |
Abbreviations: CI = Confidence Interval; MOE = Margin of Error; LCB = Lower Confidence Bound; UCB = Upper Confidence Bound; DEFF = Design Effect; Pearson's Chi-square test with a Rao & Scott adjustment: F = 417.879 (p<0.001) | ||||||||||
Proportion | MOE (Prop) | 95% CI | LCB | UCB | DEFF | Estimated Total | MOE (Total) | Unweighted Cases | Domain Sample Size | |
|---|---|---|---|---|---|---|---|---|---|---|
Nassarawa | 89.9% | ±1.4 | (88.4; 91.2) | 88.7% | 91.0% | 1.34 | 52,058 | ±1,218 | 2,118 | 2,343 |
Non-sentinel LGAs | 71.2% | ±2.8 | (68.4; 73.9) | 68.8% | 73.5% | 6.42 | 661,649 | ±65,603 | 4,814 | 6,597 |
Gaya | 55.3% | ±1.6 | (53.8; 56.9) | 54.0% | 56.6% | 1.28 | 33,163 | ±1,088 | 2,766 | 4,993 |
Gabasawa | 48.7% | ±1.5 | (47.2; 50.3) | 47.5% | 50.0% | 1.33 | 28,604 | ±1,025 | 2,639 | 5,438 |
All | 70.2% | ±2.3 | (67.8; 72.4) | 68.2% | 72.1% | 13.07 | 775,474 | ±65,347 | 12,337 | 19,371 |
Abbreviations: CI = Confidence Interval; MOE = Margin of Error; LCB = Lower Confidence Bound; UCB = Upper Confidence Bound; DEFF = Design Effect; Pearson's Chi-square test with a Rao & Scott adjustment: F = 152.351 (p<0.001) | ||||||||||
Proportion | MOE (Prop) | 95% CI | LCB | UCB | DEFF | Estimated Total | MOE (Total) | Unweighted Cases | Domain Sample Size | |
|---|---|---|---|---|---|---|---|---|---|---|
Nassarawa | 9.4% | ±1.3 | (8.2; 10.7) | 8.4% | 10.5% | 1.15 | 5,433 | ±739 | 221 | 2,343 |
Gabasawa | 6.7% | ±0.8 | (5.9; 7.6) | 6.0% | 7.4% | 1.60 | 3,926 | ±503 | 343 | 5,438 |
Non-sentinel LGAs | 5.0% | ±1.0 | (4.1; 6.1) | 4.3% | 5.9% | 3.56 | 46,811 | ±10,266 | 323 | 6,597 |
Gaya | 3.9% | ±0.7 | (3.3; 4.7) | 3.4% | 4.5% | 1.52 | 2,358 | ±402 | 184 | 4,993 |
All | 5.3% | ±0.8 | (4.5; 6.2) | 4.6% | 6.0% | 7.13 | 58,527 | ±10,268 | 1,071 | 19,371 |
Abbreviations: CI = Confidence Interval; MOE = Margin of Error; LCB = Lower Confidence Bound; UCB = Upper Confidence Bound; DEFF = Design Effect; Pearson's Chi-square test with a Rao & Scott adjustment: F = 15.819 (p<0.001) | ||||||||||
Proportion | MOE (Prop) | 95% CI | LCB | UCB | DEFF | Estimated Total | MOE (Total) | Unweighted Cases | Domain Sample Size | |
|---|---|---|---|---|---|---|---|---|---|---|
Nassarawa | 40.0% | ±2.2 | (37.9; 42.2) | 38.2% | 41.9% | 1.22 | 23,183 | ±1,352 | 933 | 2,343 |
Non-sentinel LGAs | 36.3% | ±2.0 | (34.3; 38.3) | 34.6% | 38.0% | 2.97 | 336,822 | ±37,664 | 2,453 | 6,597 |
Gabasawa | 28.4% | ±1.4 | (27.0; 29.8) | 27.2% | 29.6% | 1.39 | 16,640 | ±884 | 1,547 | 5,438 |
Gaya | 26.5% | ±1.4 | (25.1; 27.9) | 25.3% | 27.7% | 1.36 | 15,859 | ±904 | 1,323 | 4,993 |
All | 35.5% | ±1.7 | (33.8; 37.2) | 34.1% | 36.9% | 6.33 | 392,503 | ±37,546 | 6,256 | 19,371 |
Abbreviations: CI = Confidence Interval; MOE = Margin of Error; LCB = Lower Confidence Bound; UCB = Upper Confidence Bound; DEFF = Design Effect; Pearson's Chi-square test with a Rao & Scott adjustment: F = 34.816 (p<0.001) | ||||||||||
Proportion | MOE (Prop) | 95% CI | LCB | UCB | DEFF | Estimated Total | MOE (Total) | Unweighted Cases | Domain Sample Size | |
|---|---|---|---|---|---|---|---|---|---|---|
Gabasawa | 90.2% | ±0.9 | (89.3; 91.1) | 89.4% | 90.9% | 1.28 | 52,934 | ±1,018 | 4,870 | 5,438 |
Gaya | 88.8% | ±1.0 | (87.7; 89.7) | 87.9% | 89.6% | 1.31 | 53,195 | ±1,037 | 4,436 | 4,993 |
Non-sentinel LGAs | 73.5% | ±3.7 | (69.6; 77.1) | 70.3% | 76.6% | 12.28 | 683,048 | ±73,013 | 4,780 | 6,597 |
Nassarawa | 19.9% | ±1.8 | (18.2; 21.7) | 18.5% | 21.4% | 1.18 | 11,521 | ±1,032 | 462 | 2,343 |
All | 72.4% | ±3.1 | (69.2; 75.5) | 69.7% | 75.0% | 24.94 | 800,699 | ±72,718 | 14,548 | 19,371 |
Abbreviations: CI = Confidence Interval; MOE = Margin of Error; LCB = Lower Confidence Bound; UCB = Upper Confidence Bound; DEFF = Design Effect; Pearson's Chi-square test with a Rao & Scott adjustment: F = 220.968 (p<0.001) | ||||||||||
Proportion | MOE (Prop) | 95% CI | LCB | UCB | DEFF | Estimated Total | MOE (Total) | Unweighted Cases | Domain Sample Size | |
|---|---|---|---|---|---|---|---|---|---|---|
Gabasawa | 84.4% | ±1.1 | (83.3; 85.4) | 83.5% | 85.2% | 1.20 | 49,506 | ±1,060 | 4,507 | 5,438 |
Gaya | 76.1% | ±1.3 | (74.8; 77.4) | 75.0% | 77.2% | 1.19 | 45,599 | ±1,114 | 3,735 | 4,993 |
Non-sentinel LGAs | 65.5% | ±3.1 | (62.3; 68.4) | 62.9% | 68.0% | 7.02 | 607,993 | ±65,174 | 4,240 | 6,597 |
Nassarawa | 35.7% | ±2.2 | (33.6; 37.9) | 33.9% | 37.6% | 1.23 | 20,686 | ±1,326 | 820 | 2,343 |
All | 65.5% | ±2.6 | (62.9; 68.0) | 63.3% | 67.6% | 14.61 | 723,785 | ±64,923 | 13,302 | 19,371 |
Abbreviations: CI = Confidence Interval; MOE = Margin of Error; LCB = Lower Confidence Bound; UCB = Upper Confidence Bound; DEFF = Design Effect; Pearson's Chi-square test with a Rao & Scott adjustment: F = 188.392 (p<0.001) | ||||||||||
Proportion | MOE (Prop) | 95% CI | LCB | UCB | DEFF | Estimated Total | MOE (Total) | Unweighted Cases | |
|---|---|---|---|---|---|---|---|---|---|
Finished roofing (metal / tin, wood calamine / cement fibre, ceramic tile, cement or roofing shingles) | 63.1% | ±2.9 | (60.1; 65.9) | 60.6% | 65.5% | 18.22 | 695,856 | ±65,574 | 10,036 |
Natural roofing (thatch /palm leaf or sod) | 17.5% | ±2.2 | (15.3; 19.8) | 15.7% | 19.4% | 17.58 | 192,613 | ±27,705 | 4,572 |
Rudimentary roofing (rustic mat, palm / bamboo, wood planks, cardboard) | 17.3% | ±1.7 | (15.7; 19.1) | 15.9% | 18.8% | 10.14 | 191,082 | ±23,690 | 4,230 |
No roof | 1.8% | ±0.8 | (1.2; 2.8) | 1.3% | 2.6% | 16.32 | 20,191 | ±9,958 | 377 |
Other (specify) | 0.3% | ±0.2 | (0.1; 0.7) | 0.2% | 0.6% | 9.93 | 3,403 | ±906 | 95 |
Don't know or cannot be determined from outside | 2,207 | ±1,284 | 61 | ||||||
All | 100.0% | 100.0% | 100.0% | 1,105,353 | ±85,311 | 19,371 | |||
Abbreviations: CI = Confidence Interval; MOE = Margin of Error; LCB = Lower Confidence Bound; UCB = Upper Confidence Bound; DEFF = Design Effect; Domain sample size = 19,371 | |||||||||
Proportion | MOE (Prop) | 95% CI | LCB | UCB | DEFF | Estimated Total | MOE (Total) | Unweighted Cases | |
|---|---|---|---|---|---|---|---|---|---|
Finished walls (cement stone with lime / cement, bricks, cement blocks, covered adobe, wood planks / shingles) | 46.9% | ±3.5 | (43.4; 50.3) | 44.0% | 49.8% | 24.27 | 517,883 | ±54,825 | 7,462 |
Rudimentary walls (bamboo, with mud, stone with mud, uncovered adobe, plywood, cardboard, reused wood ) | 32.7% | ±2.9 | (29.9; 35.6) | 30.4% | 35.1% | 18.69 | 361,380 | ±43,569 | 6,637 |
Natural walls (cane / palm / trunks or dirt) | 19.7% | ±2.4 | (17.4; 22.3) | 17.8% | 21.9% | 18.87 | 217,980 | ±31,524 | 4,959 |
No walls | 0.5% | ±0.1 | (0.3; 0.6) | 0.4% | 0.6% | 2.20 | 5,111 | ±1,699 | 223 |
Other (specify) | 0.2% | ±0.1 | (0.2; 0.3) | 0.2% | 0.3% | 1.92 | 2,536 | ±864 | 80 |
Don't know or cannot be determined from outside | 462 | ±139 | 10 | ||||||
All | 100.0% | 100.0% | 100.0% | 1,105,353 | ±85,311 | 19,371 | |||
Abbreviations: CI = Confidence Interval; MOE = Margin of Error; LCB = Lower Confidence Bound; UCB = Upper Confidence Bound; DEFF = Design Effect; Domain sample size = 19,371 | |||||||||
Proportion | MOE (Prop) | 95% CI | LCB | UCB | DEFF | Estimated Total | MOE (Total) | Unweighted Cases | |
|---|---|---|---|---|---|---|---|---|---|
Poorest | 18.4% | ±2.4 | (16.2; 21.0) | 16.5% | 20.5% | 19.22 | 203,811 | ±31,638 | 5,238 |
Poorer | 19.1% | ±2.1 | (17.1; 21.3) | 17.4% | 21.0% | 14.93 | 211,280 | ±32,011 | 3,824 |
Middle | 20.3% | ±2.0 | (18.4; 22.4) | 18.7% | 22.0% | 11.93 | 224,797 | ±29,193 | 3,473 |
Richer | 20.6% | ±2.3 | (18.4; 23.0) | 18.7% | 22.6% | 16.50 | 227,904 | ±30,740 | 3,118 |
Richest | 21.5% | ±2.8 | (18.8; 24.4) | 19.2% | 23.9% | 23.31 | 237,561 | ±33,324 | 3,718 |
All | 100.0% | 100.0% | 1,105,353 | ±85,311 | 19,371 | ||||
Abbreviations: CI = Confidence Interval; MOE = Margin of Error; LCB = Lower Confidence Bound; UCB = Upper Confidence Bound; DEFF = Design Effect; Domain sample size = 19,371 | |||||||||
Note: Wealth quintiles are approximated using principal components analysis, which collapses information on household characteristics and amenities into a single wealth index variable, following the well-established DHS methodology. Further details on the wealth index construction are provided in the corresponding Annex. | |||||||||
4.2 Routine Immunization
This chapter presents a routine immunization assessment for the 15 LGAs targeted in the Kano Zero-Dose Baseline Survey. It will examine how well the Kano health system is delivering vaccines to age-eligible children according to the national schedule, looking at coverage rates for different vaccines, zero-dose prevalence (both on a crude and valid basis), dropout rates between doses, vaccination timeliness, and missed opportunities for vaccination.
4.2.1 Overview and Definitions
Following the Vaccination Coverage Quality Indicators (VCQI) standard, the crude basis of calculation considers an infant to be vaccinated if there is either evidence of immunization in home-based records or if the child’s caregiver recalls that their child received the given vaccination from memory. The crude basis may describe specific vaccinations or the vaccination status of a child as a whole (e.g., crude-basis zero-dose, crude-basis fully-vaccinated, etc.).
Following the VCQI standard, this report defines the valid basis of calculation considers an infant to be vaccinated only if there is documented evidence of immunization in home-based records. In addition, for the valid basis, the following must be true: (a) The child had reached the minimum age of eligibility for this dose; (b) If the schedule specifies a maximum age of eligibility, then the child was within the allowable age range when they received the dose; and (c) If the dose is number 2 or 3 (or higher) in a sequence, then the minimum interval had passed since receiving the earlier dose, so the child was eligible to receive the next dose.
4.2.2 Vaccination Cards
For health planners in Nigeria, reliable vaccine card record keeping is crucial for generating accurate data on routine immunization coverage. Home-based records (HBRs), such as vaccination cards, are a central source of verification during household surveys and are essential for accurately assessing whether most children have received vaccines according to the national schedule, as recall from memory can be prone to human error. When cards are incomplete, unavailable, or contain unclear or inconsistent entries, it becomes difficult to determine true coverage levels, identify gaps, or plan targeted interventions. In a context where administrative data systems may have limitations, high-quality HBRs are a key tool for informing evidence-based decisions, allocating resources efficiently, and ultimately strengthening immunization program performance at local administrative levels. The following section reports on the observed frequency and quality of HBRs by the survey team.
4.2.2.1 Card availability
RI_QUAL_01
Proportion | MOE (Prop) | 95% CI | LCB | UCB | DEFF | Estimated Total | MOE (Total) | Unweighted Cases | |
|---|---|---|---|---|---|---|---|---|---|
RI Card Availability (%) | 55.4% | ±3.1 | (52.3; 58.4) | 52.8% | 57.9% | 10.67 | 339,637 | ±25,477 | 6,250 |
RI Card with Dates or Ticks (%) | 55.3% | ±3.1 | (52.3; 58.4) | 52.8% | 57.9% | 10.67 | 339,502 | ±25,479 | 6,239 |
RI Card with Dates (%) | 54.6% | ±3.0 | (51.5; 57.6) | 52.0% | 57.1% | 10.54 | 334,884 | ±25,408 | 5,986 |
RI Card with Only Clean Dates (%) | 20.7% | (19.4; 21.9) | |||||||
Abbreviations: CI = Confidence Interval; MOE = Margin of Error; LCB = Lower Confidence Bound; UCB = Upper Confidence Bound; DEFF = Design Effect; Domain sample size = 10,895; Note: Because answers follow a select-multiple format, proportions in this table do not necessarily sum to 100% | |||||||||
An estimated 55% of children aged 12–23 months who were eligible for the survey had a HBR available at the time of interview. In the vast majority of cases, caregivers presented the national immunization card, as fewer than 1% of households with HBRs showed the field team some other document. In nearly all those cases, the record contained at least one vaccination entry—whether as a date or a tick mark. However, none of the available records were found to contain only “clean” vaccination dates, defined as dates that fall within the plausible window (after birth and before the interview) and follow the correct chronological order for multi-dose series.
Proportion | MOE (Prop) | 95% CI | LCB | UCB | DEFF | Estimated Total | MOE (Total) | Unweighted Cases | |
|---|---|---|---|---|---|---|---|---|---|
Yes, I can see the card(s) | 55.1% | ±3.0 | (52.0; 58.1) | 52.5% | 57.6% | 10.58 | 337,990 | ±25,470 | 6,191 |
No, no card and no other document seen | 44.6% | ±3.1 | (41.6; 47.7) | 42.1% | 47.2% | 10.67 | 273,953 | ±27,466 | 4,645 |
Yes, I can see the other document(s) | 0.7% | ±0.2 | (0.5; 0.9) | 0.5% | 0.9% | 1.46 | 4,151 | ±1,142 | 131 |
Abbreviations: CI = Confidence Interval; MOE = Margin of Error; LCB = Lower Confidence Bound; UCB = Upper Confidence Bound; DEFF = Design Effect; Domain sample size = 10,895; Note: Because answers follow a select-multiple format, proportions in this table do not necessarily sum to 100% | |||||||||
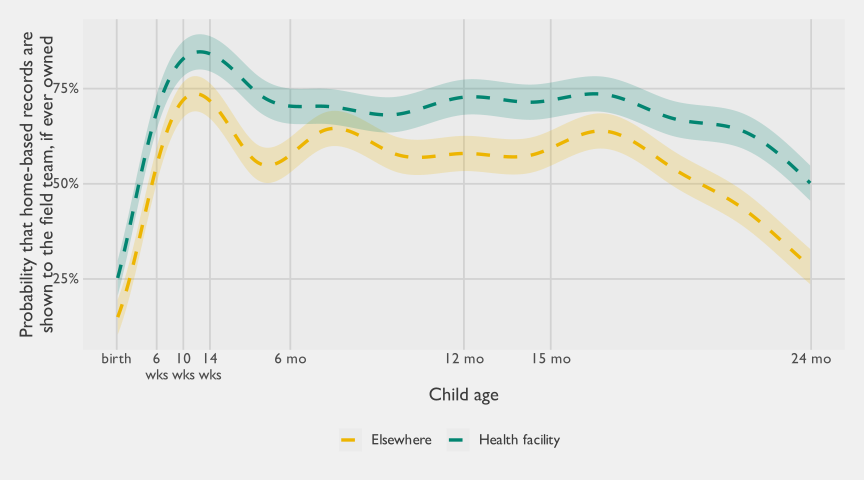
As shown in Figure 4.1, the likelihood that HBRs are available is associated with the age of the child. It is the highest in the 70%s range during the infants’ first three months of life, hovers above 60% from three to 16 months, and then drops steadily starting at 16 months to 33% likelihood at 23 months. The visualization underscores not only that recall-based assessment may be more important for vaccinations administered later in life, but also for assessing the early-infancy vaccination history of children who are nearing their second birthday.
The likelihood of seeing vaccination cards is higher for those born in the health facility (estimated at 21.2%, or 272,928 infants, as shown in Table 4.48) compared to those born elsewhere (estimated at 78.8%, or 1,015,096 infants). For both groups, this likelihood begins to drop noticeably at 16 months.
Proportion | MOE (Prop) | 95% CI | LCB | UCB | DEFF | Estimated Total | MOE (Total) | Unweighted Cases | |
|---|---|---|---|---|---|---|---|---|---|
Elsewhere | 78.8% | ±1.5 | (77.3; 80.2) | 77.6% | 80.0% | 7.59 | 1,015,096 | ±58,517 | 17,916 |
Health facility | 21.2% | ±1.5 | (19.8; 22.7) | 20.0% | 22.4% | 7.59 | 272,928 | ±20,485 | 4,953 |
All | 100.0% | 100.0% | 100.0% | 1,288,024 | ±64,766 | 22,869 | |||
Abbreviations: CI = Confidence Interval; MOE = Margin of Error; LCB = Lower Confidence Bound; UCB = Upper Confidence Bound; DEFF = Design Effect; Domain sample size = 22,869 | |||||||||
4.2.2.2 Ever had a card
RI_QUAL_02
Proportion | MOE (Prop) | 95% CI | LCB | UCB | DEFF | Estimated Total | MOE (Total) | Unweighted Cases | |
|---|---|---|---|---|---|---|---|---|---|
Yes, has only card(s) | 84.9% | ±2.0 | (82.8; 86.7) | 83.1% | 86.4% | 6.27 | 385,665 | ±28,507 | 6,935 |
No, has no card and no other document | 13.9% | ±1.9 | (12.1; 16.0) | 12.4% | 15.6% | 6.47 | 63,398 | ±9,114 | 945 |
Yes, has card(s) and other document | 0.9% | ±0.3 | (0.6; 1.2) | 0.7% | 1.2% | 1.99 | 3,979 | ±1,273 | 126 |
Yes, has only other document | 0.3% | ±0.1 | (0.2; 0.5) | 0.2% | 0.5% | 1.22 | 1,451 | ±611 | 75 |
All | 100.0% | 100.0% | 100.0% | 454,493 | ±29,749 | 8,081 | |||
Abbreviations: CI = Confidence Interval; MOE = Margin of Error; LCB = Lower Confidence Bound; UCB = Upper Confidence Bound; DEFF = Design Effect; Domain sample size = 8,081 | |||||||||
Proportiona | MOE (Prop) | 95% CI | LCB | UCB | DEFF | Estimated Total | MOE (Total) | Unweighted Cases | Domain Sample Size | |
|---|---|---|---|---|---|---|---|---|---|---|
Nassarawa | 62.7% | ±3.2 | (59.5; 65.8) | 60.0% | 65.3% | 1.22 | 17,148 | ±1,450 | 684 | 1,103 |
Gabasawa | 49.5% | ±2.6 | (46.9; 52.1) | 47.4% | 51.7% | 1.59 | 12,777 | ±935 | 1,135 | 2,276 |
Gaya | 46.9% | ±2.6 | (44.3; 49.5) | 44.7% | 49.0% | 1.39 | 11,501 | ±819 | 960 | 2,003 |
Non-sentinel LGAs | 43.7% | ±3.8 | (39.9; 47.5) | 40.5% | 46.9% | 4.13 | 164,558 | ±19,527 | 1,173 | 2,699 |
All | 45.3% | ±3.2 | (42.2; 48.5) | 42.7% | 48.0% | 8.53 | 205,984 | ±19,604 | 3,952 | 8,081 |
aProportion of infants aged 12-23 months whose caregives had home-based vaccination records at some point in time | ||||||||||
Abbreviations: CI = Confidence Interval; MOE = Margin of Error; LCB = Lower Confidence Bound; UCB = Upper Confidence Bound; DEFF = Design Effect; Pearson's Chi-square test with a Rao & Scott adjustment: F = 24.783 (p<0.001) | ||||||||||
Forty-five percent (45%) of the population who were eligible for the survey are estimated to have received at least one home-based record (vaccination card), even if they no longer have it. At 63%, the rate of HBR ownership is considerably higher for Nassarawa LGA compared to other survey areas \((d=18.5\), \(t_{(498)}=7.62\), \(p<.001)\) Although it is expected that an LGA with higher vaccination coverage would have a higher proportion of vaccination cards, what makes Nassarawa interesting is that it also had a higher than usual percentage of caregivers reporting vaccination via recall from memory \((d=11.5\), \(t_{(498)}=5.49\), \(p<.001)\).
4.2.3 Estimated Coverage
4.2.3.1 Vaccine-wise Coverage
We begin with a summary of coverage estimates for each of the principal vaccines included in Nigeria’s routine immunization schedule for infants aged 12-23 months. This vaccine-wise presentation serves as a foundation for understanding broader patterns of immunization. Table 4.51 displays point estimates for each antigen by geographic area, with more detailed statistics such as sampling errors presented in the annex (Appendix A). Table 4.52 explores how these estimates vary across key background characteristics. Characteristics include those reported in the 2023-24 Nigeria Demographic and Health Survey (NDHS) tabulation, including the household wealth quintile. Routine immunization coverage across Pathways vulnerability segments is displayed for completeness, but covered in greater detail in Section 4.2.3.5.
The LGA-based estimates in Table 4.51 provide a detailed snapshot of routine immunization performance across different geographic areas in Kano for key antigens. Within the sentinel areas, Nassarawa generally has higher coverage rates, a pattern that is generally expected given the fact it stands out as the only urban sentinel LGA. Within non-sentinel areas, Tarauni, Dawakin Tofa, and Kumbotso have the highest coverage rates, whereas Tudun Wada and Bebeji stand out as LGAs with particularly low coverage rates. Although some caution should be used in interpreting the LGA-level estimates in non-sentinel areas due to smaller sample sizes, we can see that there is wide variation in the coverage from one LGA to another. As a group, sentinel LGAs do have vaccination rates that tend to be slightly higher than the non-sentinel areas. Indeed, using Penta-1 as a representative case, we find that the 6.0-point difference between sentinel and non-sentinel areas is small but statistically significant in a design-based \(t\)-test \((d=-6.0\), \(t_{(498)}=-3.61\), \(p<.001)\). However, it should be noted that pairwise comparisons from specific LGAs in each grouping– sentinel and non-sentinel– do not allows follow the same patterns observed by comparing their umbrella groups.
Infants 12-23 months | 15-23 months | |||||||||||||||||||||||||
|---|---|---|---|---|---|---|---|---|---|---|---|---|---|---|---|---|---|---|---|---|---|---|---|---|---|---|
BCG | HepB | OPV | Penta | IPV | Pneumococcal | Rotavirus | MCV1 | YF | Meni. | Fully vaccinated | Zero-dose | Sampled # of children | ||||||||||||||
0 | 1 | 2 | 3 | 1 | 2 | 3 | 1 | 2 | 1 | 2 | 3 | 1 | 2 | 3 | B.A.a | N.I.S.b | Truec | Gavid | MCV2 | |||||||
Sentinel | 70.4 | 57.2 | 67.6 | 68.1 | 65.5 | 61.0 | 67.7 | 66.3 | 64.8 | 65.3 | 42.8 | 67.2 | 65.9 | 63.9 | 66.7 | 65.1 | 61.7 | 63.4 | 32.5 | 31.1 | 61.9 | 21.8 | 28.9 | 32.3 | 7,287 | 58.9 |
Nassarawa | 79.7 | 72.2 | 77.0 | 75.8 | 70.8 | 63.7 | 74.7 | 72.1 | 70.0 | 74.0 | 40.0 | 73.9 | 71.1 | 68.4 | 73.1 | 70.1 | 66.5 | 68.2 | 22.2 | 19.8 | 66.2 | 16.4 | 19.6 | 25.3 | 1,283 | 61.6 |
Gabasawa | 68.7 | 53.3 | 66.2 | 66.9 | 64.8 | 60.7 | 66.8 | 65.9 | 64.6 | 65.0 | 47.5 | 66.5 | 65.7 | 63.9 | 66.4 | 65.4 | 61.9 | 63.1 | 38.1 | 38.0 | 61.3 | 25.8 | 30.5 | 33.2 | 3,092 | 58.2 |
Gaya | 63.6 | 47.6 | 60.5 | 62.5 | 61.4 | 58.7 | 62.1 | 61.5 | 60.5 | 57.9 | 40.8 | 62.0 | 61.3 | 59.9 | 61.4 | 60.2 | 57.4 | 59.5 | 36.3 | 34.5 | 58.7 | 22.9 | 35.7 | 37.9 | 2,912 | 57.2 |
Non-sentinel | 64.6 | 53.6 | 65.7 | 63.2 | 60.4 | 56.5 | 61.7 | 60.0 | 58.2 | 61.1 | 55.0 | 61.7 | 60.1 | 57.6 | 61.4 | 59.6 | 56.3 | 57.1 | 49.0 | 48.5 | 56.0 | 37.3 | 33.6 | 38.3 | 3,608 | 50.1 |
Tarauni | 84.3 | 78.5 | 81.7 | 79.5 | 74.7 | 71.4 | 81.5 | 78.8 | 75.3 | 80.1 | 78.6 | 80.2 | 78.8 | 74.0 | 81.5 | 80.1 | 77.1 | 74.8 | 62.7 | 60.8 | 72.8 | 58.4 | 15.7 | 18.5 | 85 | 63.6 |
Kumbotso | 79.8 | 72.4 | 79.6 | 74.9 | 71.5 | 67.0 | 76.3 | 74.0 | 72.0 | 75.5 | 67.5 | 76.1 | 74.2 | 70.0 | 75.6 | 73.0 | 68.0 | 70.2 | 59.6 | 59.0 | 69.0 | 51.8 | 19.4 | 23.7 | 484 | 66.9 |
Dawakin Tofa | 77.5 | 63.0 | 78.8 | 77.6 | 76.7 | 71.8 | 76.3 | 75.7 | 74.1 | 75.7 | 71.5 | 76.0 | 75.4 | 73.8 | 75.1 | 74.5 | 73.1 | 73.5 | 64.7 | 63.6 | 73.5 | 49.0 | 21.2 | 23.7 | 231 | 65.2 |
Ungogo | 74.0 | 67.5 | 77.2 | 73.5 | 69.6 | 63.4 | 69.5 | 67.4 | 62.3 | 68.4 | 57.4 | 69.7 | 67.6 | 62.5 | 68.8 | 67.2 | 61.4 | 62.6 | 52.8 | 52.1 | 59.4 | 41.8 | 22.8 | 30.5 | 310 | 55.6 |
Dambatta | 71.1 | 58.4 | 72.0 | 70.7 | 66.2 | 61.8 | 68.7 | 65.7 | 62.5 | 67.2 | 62.0 | 68.9 | 66.5 | 62.3 | 68.3 | 64.7 | 61.0 | 61.3 | 46.6 | 47.0 | 59.1 | 35.1 | 27.1 | 31.3 | 219 | 54.7 |
Takai | 63.3 | 47.4 | 67.1 | 63.2 | 61.3 | 53.8 | 61.0 | 60.3 | 58.2 | 60.2 | 51.6 | 61.0 | 60.3 | 57.0 | 59.9 | 59.2 | 55.4 | 57.0 | 50.6 | 50.7 | 56.5 | 33.8 | 32.9 | 39.0 | 280 | 46.4 |
Gezawa | 61.5 | 46.7 | 61.1 | 59.9 | 58.6 | 55.7 | 59.7 | 58.7 | 58.0 | 59.6 | 52.5 | 59.7 | 58.7 | 57.8 | 59.6 | 58.7 | 55.3 | 55.8 | 48.9 | * | 55.8 | 31.1 | 38.5 | 40.3 | 228 | 46.1 |
Kiru | 60.6 | 48.7 | 63.2 | 61.2 | 57.9 | 55.5 | 58.9 | 56.9 | 56.2 | 58.5 | 53.7 | 59.2 | 56.7 | 56.3 | 58.4 | 56.4 | 53.9 | 55.3 | 43.3 | 45.1 | 54.1 | 33.2 | 35.9 | 41.1 | 422 | 49.2 |
Sumaila | 58.5 | 43.0 | 59.3 | 58.0 | 55.0 | 52.2 | 56.4 | 53.4 | 52.8 | 54.4 | 48.4 | 56.4 | 53.4 | 52.5 | 56.1 | 52.6 | 50.6 | 50.6 | 42.2 | 41.5 | 49.7 | 29.0 | 40.1 | 43.6 | 395 | 45.6 |
Dawakin Kudu | 57.2 | 48.0 | 57.7 | 55.4 | 53.9 | 51.3 | 54.2 | 53.4 | 52.1 | 54.3 | 49.5 | 54.5 | 53.4 | 51.3 | 53.8 | 53.1 | 48.8 | 52.3 | 46.9 | 46.5 | 51.0 | 35.7 | 40.6 | 45.8 | 300 | 45.4 |
Bebeji | 53.6 | 48.3 | 52.2 | 50.3 | 48.8 | 44.9 | 49.7 | 48.1 | 46.6 | 50.4 | 46.5 | 49.7 | 48.3 | 46.7 | 49.7 | 48.1 | 45.2 | 45.9 | 40.9 | 39.2 | 45.2 | 34.8 | 45.3 | 50.3 | 267 | 34.1 |
Tudun Wada | 51.4 | 42.7 | 52.9 | 49.4 | 45.3 | 43.2 | 47.1 | 45.4 | 44.7 | 47.0 | 44.9 | 47.3 | 45.6 | 43.3 | 48.0 | 46.1 | 44.2 | 43.4 | 39.9 | 39.8 | 43.1 | 32.1 | 46.7 | 52.9 | 387 | 35.4 |
All | 65.5 | 54.2 | 66.0 | 64.0 | 61.2 | 57.2 | 62.7 | 61.0 | 59.3 | 61.8 | 53.0 | 62.6 | 61.0 | 58.6 | 62.3 | 60.5 | 57.2 | 58.1 | 46.3 | 45.6 | 57.0 | 34.7 | 32.8 | 37.3 | 10,895 | 51.5 |
Note: Children are considered to have received the vaccine if it was either written on the child’s vaccination card or reported by the caregiver. For children whose vaccination information is based on the caregiver's report, date of vaccination is not collected. The proportions of vaccinations given during the first and second years of life are assumed to be the same as for children with a written record of vaccination. Unreliable proportions have been suppressed and replaced with asterisks. For more detailed statistical output, please see the appendices. | ||||||||||||||||||||||||||
aBasic antigens: BCG, three doses of pentavalent (DPT-HepB-Hib), a complete series of either IPV or OPV (excluding polio vaccine given at birth) or a combination of at least one each of IPV and OPV, and one dose of measles vaccine. | ||||||||||||||||||||||||||
bNigeria immunization schedule: BCG, HepB (birth dose), three doses of DPT-HepB-Hib (pentavalent), four doses of OPV, two doses of IPV, three doses of pneumococcal vaccine, three doses of rotavirus, one dose of measles vaccine, one dose of yellow fever vaccine, and one dose of meningitis vaccine. The second measles dose is excluded as children become eligible to receive it at 15 months. | ||||||||||||||||||||||||||
cTrue zero-dose children lacking evidence of any vaccine. Cases where the cargiver initially reports the child as having received vaccines (Q409) but is subsequently unable to recall which antigens were administered are recorded as zero-dose children. | ||||||||||||||||||||||||||
dGavi operationalizes zero-dose children as those who have not received a DPT-containing vaccine. | ||||||||||||||||||||||||||
Coverage of birth doses across the entire survey area was mixed. Bacille Calmette-Guérin (BCG) coverage was 65.6%, followed by 54.2% for the Hepatitis B birth dose, and 66.1% for Oral Polio Vaccine at Birth (OPV0). While a majority of infants received at least one of the birth vaccines, the lower coverage for Hepatitis B (HepB) suggests potential gaps in timely administration, particularly for doses requiring cold chain management and coordination at birth. The discrepancy between BCG and OPV0 versus HepB may reflect operational challenges in administering HepB within the critical 24-hour window after birth. If true, these explanations may suggest that strengthening birth services and early outreach could improve protection against early-life infections.
Coverage for vaccines administered between 6 weeks and 6 months of age, the above table shows a relatively consistent pattern across the survey area. For each of these doses, coverage levels cluster in the range of approximately 55% to 63%, with only modest attrition from the first to the third dose in multi-dose series. This suggests that once children are engaged with the immunization system in early infancy, a majority tend to receive the subsequent doses in a timely manner. The consistency across these antigens likely reflects routine contact points during early infancy and the bundling of multiple vaccines at the same visit.
In contrast, coverage begins to decline sharply for vaccines administered at or after 9 months of age. Yellow Fever (YF) coverage stands at just 46.3%, and meningitis coverage is even lower at 45.7%, representing a significant drop compared to earlier vaccines.1 The drop-off may be due to fewer scheduled contact points beyond 6 months, weaker demand or recall systems for later doses, and a potential lower emphasis of targeted outreach for the 9-month visit. This pattern raises concerns about missed opportunities for protection against high-burden diseases and highlights the need for programmatic attention to sustaining vaccination engagement beyond early infancy.
Turning to Table 4.52, we can also observe some stark differences in coverage patterns—as well as areas of ostensible parity—by background characteristic. The sex of the child does not appear to have a significant bearing on the rate of vaccination, and a \(t\)-test fails to find a statistically significant difference between the sexes for Penta-1 prevalence \((d=-3.0\), \(t_{(498)}=-1.72\), \(p=.087)\). The birth order likewise shows trivially small and non-significant differences in vaccination patterns across the different antigens and doses in a design-based Wald test \((F_{(3, 496)}=0.3\), \(p=.791)\).
Infants 12-23 months | 15-23 months | |||||||||||||||||||||||||
|---|---|---|---|---|---|---|---|---|---|---|---|---|---|---|---|---|---|---|---|---|---|---|---|---|---|---|
BCG | HepB | OPV | Penta | IPV | Pneumococcal | Rotavirus | MCV1 | YF | Meni. | Fully vaccinated | Zero-dose | Sampled # of children | ||||||||||||||
0 | 1 | 2 | 3 | 1 | 2 | 3 | 1 | 2 | 1 | 2 | 3 | 1 | 2 | 3 | B.A.a | N.I.S.b | Truec | Gavid | MCV2 | |||||||
Sex of child | ||||||||||||||||||||||||||
Girls | 67.5 | 55.6 | 67.9 | 65.5 | 62.6 | 58.6 | 64.3 | 63.0 | 61.0 | 63.5 | 54.6 | 64.2 | 63.0 | 60.3 | 63.9 | 62.5 | 59.1 | 60.0 | 48.1 | 47.6 | 58.9 | 36.1 | 30.9 | 35.7 | 5,366 | 53.8 |
Boys | 63.7 | 52.9 | 64.3 | 62.6 | 59.9 | 56.0 | 61.3 | 59.2 | 57.7 | 60.2 | 51.5 | 61.2 | 59.2 | 57.1 | 60.7 | 58.7 | 55.4 | 56.4 | 44.6 | 43.8 | 55.3 | 33.4 | 34.5 | 38.7 | 5,529 | 49.4 |
Birth order | ||||||||||||||||||||||||||
1 | 65.9 | 55.8 | 67.0 | 64.7 | 62.4 | 57.4 | 63.1 | 61.5 | 59.5 | 61.9 | 52.2 | 63.0 | 61.6 | 59.1 | 62.7 | 61.1 | 57.5 | 57.9 | 45.3 | 44.5 | 56.7 | 34.7 | 32.0 | 36.9 | 5,956 | 50.9 |
2-3 | 65.6 | 54.5 | 65.2 | 64.0 | 60.3 | 57.4 | 63.5 | 60.6 | 59.0 | 62.7 | 55.2 | 63.4 | 60.5 | 58.1 | 62.8 | 60.1 | 57.9 | 59.0 | 47.5 | 47.4 | 57.6 | 37.3 | 33.7 | 36.5 | 1,862 | 55.1 |
4-5 | 64.3 | 51.4 | 64.7 | 61.4 | 59.3 | 56.3 | 60.8 | 60.3 | 59.9 | 60.3 | 53.3 | 61.0 | 60.2 | 59.0 | 60.5 | 59.9 | 56.6 | 58.6 | 48.9 | 48.3 | 58.4 | 34.3 | 34.3 | 39.2 | 1,221 | 51.5 |
6+ | 64.8 | 51.2 | 64.5 | 63.1 | 60.4 | 57.6 | 62.1 | 60.4 | 59.4 | 61.2 | 53.5 | 61.9 | 60.2 | 58.0 | 62.0 | 60.0 | 55.7 | 58.4 | 47.3 | 46.0 | 57.2 | 33.2 | 33.5 | 37.9 | 1,264 | 50.3 |
Degree of urbanization | ||||||||||||||||||||||||||
City | 76.0 | 70.3 | 75.7 | 72.4 | 68.8 | 63.3 | 71.9 | 69.6 | 66.8 | 70.6 | 57.6 | 71.7 | 69.4 | 65.8 | 71.2 | 69.0 | 64.8 | 65.5 | 46.7 | 45.9 | 63.4 | 40.3 | 22.8 | 28.1 | 2,926 | 59.2 |
Town | 68.8 | 54.1 | 70.3 | 68.2 | 65.4 | 62.8 | 65.8 | 64.8 | 63.6 | 65.9 | 58.2 | 65.8 | 64.8 | 62.8 | 65.1 | 64.0 | 61.2 | 63.4 | 51.9 | 52.1 | 62.2 | 38.1 | 28.3 | 34.2 | 2,802 | 56.9 |
Suburban | 62.2 | 48.8 | 62.7 | 61.2 | 59.2 | 56.2 | 59.7 | 58.2 | 56.8 | 58.5 | 50.9 | 59.7 | 58.3 | 56.7 | 59.3 | 57.8 | 54.8 | 55.5 | 47.1 | 46.2 | 54.8 | 32.7 | 36.5 | 40.3 | 3,775 | 47.2 |
Village | 50.3 | 38.0 | 50.9 | 50.0 | 47.2 | 41.7 | 49.1 | 47.4 | 45.9 | 48.1 | 42.7 | 49.1 | 47.4 | 45.2 | 49.5 | 47.3 | 44.0 | 44.3 | 36.8 | 35.7 | 44.2 | 24.9 | 48.2 | 50.9 | 1,392 | 39.1 |
Card status | ||||||||||||||||||||||||||
HBR seen | 99.9 | 81.6 | 99.1 | 97.9 | 96.5 | 93.9 | 97.8 | 96.2 | 94.3 | 96.8 | 85.7 | 97.7 | 96.2 | 94.2 | 97.5 | 95.8 | 91.1 | 92.0 | 82.5 | 82.0 | 91.4 | 62.6 | 0.0 | 2.2 | 6,178 | 84.6 |
HBR not seen | 80.1 | 72.8 | 77.3 | 68.8 | 55.7 | 37.9 | 68.3 | 63.4 | 58.1 | 63.4 | 45.3 | 67.4 | 62.8 | 50.6 | 64.8 | 59.7 | 55.0 | 56.6 | 6.8 | 4.4 | 53.0 | 2.8 | 18.6 | 31.7 | 669 | 44.1 |
Never had HBR | 14.4 | 12.2 | 17.2 | 15.0 | 12.1 | 8.2 | 11.9 | 10.6 | 9.8 | 11.6 | 7.9 | 12.0 | 10.7 | 9.5 | 11.8 | 10.6 | 9.4 | 10.3 | * | 0.7 | 8.9 | 0.4 | 81.8 | 88.1 | 4,048 | 9.9 |
Highest education level completed (caregiver) | ||||||||||||||||||||||||||
No education | 58.0 | 45.2 | 58.8 | 57.3 | 55.0 | 51.3 | 55.5 | 54.3 | 53.1 | 54.9 | 48.1 | 55.5 | 54.3 | 52.6 | 55.3 | 54.0 | 51.3 | 52.0 | 42.5 | 41.6 | 51.4 | 30.1 | 40.0 | 44.5 | 7,294 | 45.8 |
Primary | 71.8 | 56.8 | 71.9 | 69.2 | 65.2 | 61.3 | 69.2 | 65.7 | 62.9 | 67.2 | 53.5 | 68.8 | 65.6 | 61.9 | 67.6 | 64.5 | 60.2 | 61.9 | 47.3 | 47.8 | 59.8 | 32.1 | 26.7 | 30.8 | 1,131 | 52.9 |
Secondary | 81.0 | 73.9 | 80.9 | 77.5 | 74.2 | 69.1 | 76.8 | 74.3 | 71.4 | 75.5 | 63.6 | 76.6 | 74.3 | 71.0 | 76.1 | 73.6 | 69.0 | 70.3 | 55.0 | 54.7 | 68.3 | 46.7 | 18.1 | 23.2 | 2,119 | 62.6 |
More than secondary | 86.6 | 84.6 | 85.9 | 84.6 | 81.1 | 76.3 | 85.2 | 84.8 | 83.4 | 84.2 | 72.1 | 85.1 | 84.8 | 80.3 | 84.8 | 84.3 | 80.8 | 81.1 | 56.3 | 55.2 | 79.9 | 49.5 | 13.3 | 14.8 | 351 | 73.5 |
Place of delivery | ||||||||||||||||||||||||||
Health facility | 81.0 | 71.7 | 80.4 | 77.3 | 74.9 | 69.2 | 76.9 | 74.8 | 72.0 | 75.3 | 63.7 | 76.5 | 74.7 | 71.0 | 76.4 | 74.5 | 70.3 | 70.4 | 53.0 | 52.2 | 69.2 | 43.1 | 18.1 | 23.1 | 2,299 | 61.5 |
Elsewhere | 61.5 | 49.7 | 62.3 | 60.5 | 57.7 | 54.1 | 59.0 | 57.5 | 56.0 | 58.2 | 50.2 | 59.0 | 57.5 | 55.5 | 58.6 | 56.9 | 53.8 | 55.0 | 44.5 | 43.9 | 53.9 | 32.6 | 36.6 | 41.0 | 8,596 | 49.0 |
Pathways type | ||||||||||||||||||||||||||
U1-NN | 91.8 | 87.7 | 90.6 | 88.5 | 84.2 | 75.9 | 88.8 | 85.6 | 79.8 | 85.9 | 67.6 | 88.0 | 85.4 | 79.1 | 87.9 | 84.9 | 77.4 | 81.3 | 57.7 | 56.7 | 77.8 | 48.8 | 8.2 | 11.2 | 360 | 72.9 |
U3-NN | 79.3 | 74.1 | 78.4 | 76.0 | 72.2 | 67.2 | 75.7 | 74.0 | 71.5 | 74.2 | 62.8 | 75.1 | 73.9 | 70.3 | 75.1 | 73.6 | 70.1 | 70.3 | 51.9 | 50.9 | 68.3 | 46.4 | 20.4 | 24.3 | 1,328 | 64.5 |
U2-NN | 79.4 | 74.4 | 82.9 | 79.7 | 77.2 | 74.3 | 77.2 | 73.7 | 72.3 | 75.4 | 60.3 | 76.7 | 73.2 | 70.5 | 75.6 | 72.0 | 69.8 | 66.9 | 52.5 | 50.3 | 65.6 | 43.2 | 15.8 | 22.8 | 354 | 55.7 |
R2-NN | 69.5 | 58.8 | 70.1 | 66.7 | 64.0 | 59.9 | 65.3 | 63.3 | 61.5 | 65.2 | 57.0 | 65.6 | 63.3 | 61.2 | 64.9 | 62.5 | 59.2 | 60.9 | 47.6 | 49.1 | 59.5 | 37.4 | 29.3 | 34.7 | 1,214 | 53.1 |
R3.1-NN | 65.7 | 51.0 | 65.3 | 64.9 | 62.3 | 58.8 | 63.6 | 62.6 | 61.1 | 62.2 | 54.2 | 63.8 | 62.8 | 60.5 | 63.0 | 61.8 | 58.2 | 59.9 | 47.1 | 45.8 | 58.6 | 33.3 | 33.1 | 36.4 | 1,367 | 50.3 |
R3.2-NN | 60.5 | 46.0 | 60.6 | 59.4 | 57.0 | 54.0 | 58.4 | 57.1 | 56.2 | 57.8 | 51.4 | 58.4 | 57.1 | 55.6 | 58.1 | 56.8 | 53.9 | 54.8 | 46.4 | 45.3 | 54.4 | 31.8 | 38.2 | 41.6 | 4,106 | 47.5 |
U4-NN | 62.3 | 51.7 | 64.5 | 60.7 | 58.1 | 52.9 | 57.8 | 55.9 | 53.5 | 56.5 | 45.3 | 57.9 | 56.0 | 53.0 | 57.5 | 55.7 | 52.0 | 53.1 | 41.1 | 40.8 | 51.6 | 30.7 | 34.3 | 42.2 | 1,430 | 48.6 |
R4-NN | 43.5 | 32.2 | 46.1 | 44.2 | 42.0 | 38.2 | 42.5 | 40.9 | 39.6 | 42.7 | 37.3 | 42.5 | 40.9 | 39.5 | 42.3 | 40.7 | 38.8 | 37.8 | 31.7 | 32.1 | 37.7 | 21.9 | 53.5 | 57.5 | 598 | 33.4 |
Ethnic group | ||||||||||||||||||||||||||
Hausa | 67.6 | 55.9 | 67.9 | 65.9 | 62.9 | 59.4 | 64.7 | 62.9 | 61.3 | 63.9 | 55.2 | 64.6 | 62.9 | 60.7 | 64.3 | 62.5 | 59.3 | 60.0 | 48.3 | 47.9 | 58.9 | 36.4 | 31.0 | 35.3 | 8,552 | 52.7 |
Other | 71.7 | 66.5 | 71.6 | 64.5 | 63.5 | 57.3 | 64.9 | 64.4 | 63.8 | 64.1 | 51.9 | 64.3 | 63.6 | 60.8 | 64.4 | 63.6 | 60.8 | 62.5 | 42.7 | 42.1 | 61.8 | 35.0 | 28.3 | 35.1 | 225 | 58.7 |
Fulani | 54.8 | 44.6 | 56.3 | 54.7 | 53.0 | 46.7 | 52.7 | 51.6 | 49.1 | 51.1 | 42.6 | 52.7 | 51.6 | 48.5 | 52.2 | 50.9 | 46.3 | 48.5 | 37.0 | 34.8 | 47.4 | 26.3 | 42.4 | 47.3 | 2,118 | 45.0 |
Religious affiliation | ||||||||||||||||||||||||||
Muslim | 65.3 | 54.0 | 65.8 | 63.8 | 61.0 | 57.0 | 62.5 | 60.8 | 59.1 | 61.6 | 52.9 | 62.4 | 60.8 | 58.4 | 62.1 | 60.4 | 57.0 | 58.1 | 46.3 | 45.7 | 56.9 | 34.8 | 33.0 | 37.5 | 10,823 | 51.4 |
Other | 88.0 | * | 89.3 | 87.5 | 87.1 | 84.5 | 86.0 | 85.7 | 85.7 | 81.6 | * | 85.8 | 85.4 | 82.6 | 83.8 | 82.5 | 81.2 | * | 49.4 | 41.3 | * | 28.9 | * | 14.0 | 67 | 62.0 |
Wealth quintile | ||||||||||||||||||||||||||
Poorest | 55.6 | 42.6 | 56.0 | 56.3 | 53.8 | 50.7 | 54.7 | 53.1 | 51.7 | 53.7 | 45.7 | 54.8 | 53.2 | 51.3 | 54.3 | 52.4 | 49.0 | 50.1 | 41.5 | 39.3 | 49.6 | 28.5 | 42.7 | 45.3 | 2,981 | 43.0 |
Poorer | 57.2 | 45.1 | 58.3 | 55.8 | 53.1 | 49.8 | 53.6 | 52.6 | 51.5 | 53.3 | 46.2 | 53.7 | 52.7 | 51.3 | 53.4 | 51.9 | 50.1 | 50.0 | 40.3 | 39.8 | 49.2 | 28.5 | 40.1 | 46.4 | 2,115 | 43.3 |
Middle | 63.3 | 48.1 | 64.4 | 62.9 | 60.9 | 57.2 | 61.1 | 59.6 | 58.5 | 59.9 | 53.6 | 60.8 | 59.4 | 57.8 | 61.0 | 59.6 | 56.4 | 58.0 | 48.1 | 47.8 | 57.6 | 33.3 | 34.5 | 38.9 | 2,114 | 50.9 |
Richer | 67.6 | 57.3 | 68.4 | 65.8 | 62.9 | 58.7 | 64.3 | 62.3 | 60.8 | 63.9 | 55.3 | 64.6 | 62.5 | 60.0 | 63.8 | 62.0 | 59.4 | 59.2 | 48.5 | 48.8 | 57.6 | 38.3 | 30.9 | 35.7 | 1,742 | 51.2 |
Richest | 82.8 | 77.0 | 81.8 | 78.0 | 74.3 | 68.5 | 78.6 | 76.4 | 72.9 | 77.0 | 63.0 | 78.2 | 76.2 | 71.8 | 77.7 | 75.5 | 70.0 | 72.1 | 51.9 | 51.1 | 70.0 | 44.2 | 16.9 | 21.4 | 1,943 | 67.1 |
All | 65.5 | 54.2 | 66.0 | 64.0 | 61.2 | 57.2 | 62.7 | 61.0 | 59.3 | 61.8 | 53.0 | 62.6 | 61.0 | 58.6 | 62.3 | 60.5 | 57.2 | 58.1 | 46.3 | 45.6 | 57.0 | 34.7 | 32.8 | 37.3 | 10,895 | 51.5 |
Note: Children are considered to have received the vaccine if it was either written on the child’s vaccination card or reported by the caregiver. For children whose vaccination information is based on the caregiver's report, date of vaccination is not collected. The proportions of vaccinations given during the first and second years of life are assumed to be the same as for children with a written record of vaccination. Unreliable proportions have been suppressed and replaced with asterisks. For more detailed statistical output, please see the appendices. | ||||||||||||||||||||||||||
aBasic antigens: BCG, three doses of pentavalent (DPT-HepB-Hib), a complete series of either IPV or OPV (excluding polio vaccine given at birth) or a combination of at least one each of IPV and OPV, and one dose of measles vaccine. | ||||||||||||||||||||||||||
bNigeria immunization schedule: BCG, HepB (birth dose), three doses of DPT-HepB-Hib (pentavalent), four doses of OPV, two doses of IPV, three doses of pneumococcal vaccine, three doses of rotavirus, one dose of measles vaccine, one dose of yellow fever vaccine, and one dose of meningitis vaccine. The second measles dose is excluded as children become eligible to receive it at 15 months. | ||||||||||||||||||||||||||
cTrue zero-dose children lacking evidence of any vaccine. Cases where the cargiver initially reports the child as having received vaccines (Q409) but is subsequently unable to recall which antigens were administered are recorded as zero-dose children. | ||||||||||||||||||||||||||
dGavi operationalizes zero-dose children as those who have not received a DPT-containing vaccine. | ||||||||||||||||||||||||||
Other background characteristics in Table 4.52 show much stronger differences.
Not surprisingly, children in urban areas tend to have a consistently higher rate of vaccination than their peers in rural areas \((d=-10.9\), \(t_{(498)}=-4.12\), \(p<.001)\). This is further confirmed by examining how the observed vaccination prevalence generally goes up as the degree of urbanization2 increases. This pattern may be related to observed difference in vaccination based on the delivery location of the child, with infants born in non-clinical settings being showing a considerably lower rate of vaccination compared to those delivered in a health facility \((d=-17.9\), \(t_{(498)}=-7.86\), \(p<.001)\).
Other characteristics also exhibit strong association with vaccination trends. The education level of the caregiver—typically the mother—is strongly predictive of the vaccination status of a given child. For example, the survey finds that infants in households where the caregiver has no education have a 55% chance of being Penta-1 vaccinated, compared to 85.3% for households where the mother attended post-secondary education \((d=-21.3\), \(t_{(498)}=-9.93\), \(p<.001)\). Association with ethnic groups also shows some notable differences, with ethnic Fulanis exhibiting a 10-point lower vaccination rate compared to Hausa households \((d=-11.9\), \(t_{(498)}=-4.61\), \(p<.001)\). Infants in non-Muslim households were found to have a Penta-1 coverage rate that was 24 percentage points higher compared infants in Muslim households \((d=23.5\), \(t_{(498)}=3.93\), \(p<.001)\). Many of these dimensions are captured by the Pathways type, discussed more in depth in Section 4.2.3.5.
Vaccination coverage also associated with the socio-economic status of the household \((F_{(4, 495)}=21.9\), \(p<.001)\). Using wealth quintile estimates created via Principal Components Analysis (PCA), the survey found that the Penta-1 vaccination coverage increases with a household’s wealth: Whereas the wealthiest 20% of households have an average Penta-1 vaccination rate of 78%, the poorest 20% have a considerably lower rate at 56%.
Figure 4.2 presents the correlations between individual vaccine doses, along with three indicator variables: anyvax, fv_basicand fv_full. These respectively denote children who have received at least one vaccine (i.e., the complement of truly zero-dose children), children who have received all basic antigens defined in Table 4.51, and fully-vaccinated children according to the Nigeria immunization schedule, excluding Vitamin A or the second dose of Measles-Containing Vaccine (MCV)3. All estimated correlations are strongly positive with design-based 95% confidence interval bands that exclude zero. The consistently high correlations suggest a clear pattern: children tend to be either largely up to date with their vaccinations or missing several doses. Two birth doses—OPV0 and BCG—stand out as the strongest predictors of a child’s zero-dose status, with correlations of 0.97 and 0.96, respectively. Penta-1 (Diphtheria-Pertussis-Tetanus (DPT)-1), a commonly used proxy indicator, also shows a strong association (0.91), though slightly weaker than the birth doses. By contrast, the HepB birth dose is less strongly correlated with other vaccines, a pattern also observed for YF and meningitis vaccines, both administered after nine months of age. Interestingly, the first measles dose, also given at nine months, demonstrates stronger correlations with other vaccinations than these two later vaccines. Early and mid-schedule vaccines such as DPT-1, Pneumococcal Conjugate Vaccine (PCV)-1, Oral Polio Vaccine (OPV)-1, Rotavirus (RV)-1, DPT-2, and PCV-2 are exceptionally tightly linked, with correlations ranging from 0.95 to 0.99. A part of the explanation is that this reflects opportunities for simultaneous administration, whereby children receiving one of these vaccines often receive several others during the same visit.

4.2.3.2 Crude vs. Valid
The comparison between crude and valid coverage highlights important discrepancies in the reliability and timeliness of reported vaccination uptake. Crude coverage figures– which include both documented and caregiver-reported doses regardless of timing– can overstate immunization levels for several vaccines if caregiver reports are flawed. Table 4.53 compares crude and valid coverage estimates for vaccines in the Nigeria immunization schedule, highlighting the extent to which apparent coverage drops when accounting for documentation and timeliness criteria. Across all antigens, valid coverage is consistently lower than crude coverage, with the largest discrepancies observed for birth and early infancy doses such as OPV0 (66% crude vs. 26.7% valid, a 39.3 percentage point gap) and HepB (54.2% vs. 26%).
This pattern suggests that a substantial portion of reported or recorded vaccinations either occurred outside of the recommended window or lacked adequate documentation. As children progress through the schedule, the gap between crude and valid coverage narrows. By the time of DPT-1, valid coverage reaches 51.9% compared to 62.7% crude, and by DPT-3 the gap reduces further. This trend may reflect improvements in both timeliness and record-keeping as children engage more consistently with routine services. Still, the persistent gaps—even for later doses like MCV-1 and YF—underscore the importance of strengthening both timely vaccine delivery and documentation practices to more accurately reflect true immunization system performance.
Crude coverage: | Valid coverage: | Difference | |
|---|---|---|---|
OPV0 | 66.0% (63.7; 68.3) | 26.7% (24.4; 29.3) | -39.3 |
HEPB | 54.2% (51.6; 56.7) | 26.0% (23.7; 28.5) | -28.2 |
RV3 | 57.2% (54.6; 59.8) | 30.7% (28.3; 33.2) | -26.5 |
DPT3 | 59.3% (56.6; 61.9) | 35.1% (32.7; 37.6) | -24.2 |
OPV3 | 57.2% (54.5; 59.8) | 33.1% (30.9; 35.3) | -24.1 |
PCV3 | 58.6% (56.0; 61.2) | 34.9% (32.5; 37.3) | -23.8 |
IPV2 | 53.0% (50.3; 55.7) | 30.2% (28.0; 32.6) | -22.8 |
MCV2 | 51.5% (48.3; 54.7) | 34.5% (31.3; 37.8) | -17.0 |
IPV1 | 61.8% (59.2; 64.3) | 47.1% (44.0; 50.2) | -14.7 |
RV2 | 60.5% (57.9; 63.1) | 46.6% (43.6; 49.6) | -13.9 |
MENI | 45.6% (42.7; 48.6) | 32.5% (30.2; 34.8) | -13.2 |
MCV1 | 58.1% (55.5; 60.8) | 45.2% (42.4; 48.1) | -12.9 |
OPV2 | 61.2% (58.7; 63.7) | 48.5% (45.6; 51.4) | -12.7 |
BCG | 65.5% (63.1; 67.9) | 52.9% (49.9; 55.9) | -12.6 |
PCV2 | 61.0% (58.4; 63.6) | 48.6% (45.6; 51.6) | -12.5 |
DPT2 | 61.0% (58.4; 63.6) | 48.8% (45.8; 51.8) | -12.3 |
OPV1 | 64.0% (61.5; 66.4) | 52.0% (48.9; 55.0) | -12.0 |
PCV1 | 62.6% (60.1; 65.2) | 51.8% (48.8; 54.8) | -10.8 |
DPT1 | 62.7% (60.1; 65.2) | 51.9% (48.9; 54.9) | -10.8 |
RV1 | 62.3% (59.6; 64.8) | 51.6% (48.6; 54.5) | -10.7 |
YF | 46.3% (43.5; 49.1) | 36.9% (34.3; 39.5) | -9.4 |
4.2.3.3 Zero-Dose Children
Figure 4.3, Figure 4.5, and Figure 4.4 present the estimated prevalence and number of zero-dose children—those who have not received the first dose of the pentavalent vaccine (Penta-1)—across various domains in the surveyed areas in Kano State. The vertical dashed lines mark key reference points: the yellow line at 42.2% represents the 2023–24 Demographic and Health Survey (DHS) estimate for Kano, while the green line at 20% corresponds to an aspirational target for 80% Penta-1 coverage (that is, 20% zero-dose or lower). Observed zero-dose rates vary widely across domains, with substantial disparities evident by geography, education, and health access indicators. Non-sentinel areas and certain LGAs like Gaya and Gabasawa hover near or below the DHS benchmark, with Nassarawa notably at 25%.
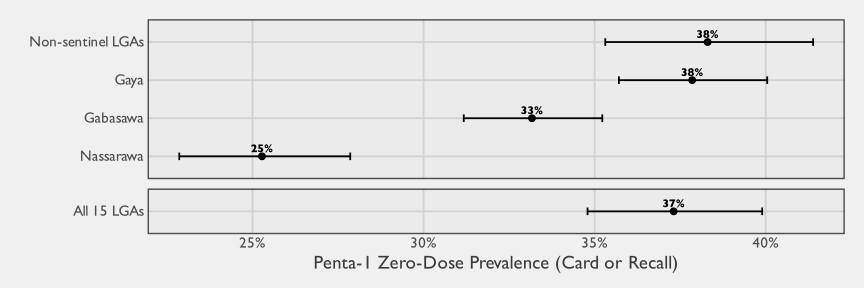
Urban–rural disparities persist, but they are less pronounced than other factors, with rural areas showing a 41% zero-dose rate versus 30% in urban areas. Based on the study, infants found in rural areas were 1.4 times as likely to be found to be zero-dose compared those in urban areas \((F_{(1, 499)}=15.7\), \(p<.001)\). Differences become more pronounced when disaggregating by the full degree of urbanization, with children in villages and sparsely inhabited areas being 1.8 times as likely as children in cities to be zero-dose \((F_{(1, 499)}=42.1\), \(p<.001)\).
By comparison, domains of interest such as sex of the child and birth order do not associate strongly with the zero-dose status. The design-based chi-square tests on these associations did not reveal statistically significant differences (\(F_{(1, 499)}=2.9\), \(p=.088\) for the sex of the child; \(F_{(2.5, 1254.3)}=0.3\), \(p=.825\) for the birth order).
Maternal education also shows a strong and statistically significant association: infants whose mothers had received no schooling whatsover were 1.8 times more likely to be zero-dose than children whose mother had a minimum of primary school \((F_{(1, 499)}=88.7\), \(p<.001)\). The delivery location and ethnic minority status also associated with a higher zero-dose prevalence above the statistically significant threshold. Children born outside of a health facility were 1.8 times as likely to be found to be zero-dose \((F_{(1, 499)}=52.2\), \(p<.001)\), and infants in Fulani households were 1.3 more likely than infants in Hausa households \((F_{(1, 499)}=20.8\), \(p<.001)\) be Penta-1 unvaccinated. These findings highlight where immunization programs might focus to close gaps—especially among vulnerable pathway segments, households without vaccination records, and mothers with limited education.

Households’ access to and presentation of HBRs is strongly associated with zero-dose prevalence. Among children in households where an HBR was never available—relying entirely on caregiver recall—the estimated Penta-1 zero-dose prevalence is 64%, indicating a substantial risk of missing routine immunization services. At the other end of the spectrum, when HBRs were seen by field teams, the Penta-1-based zero-dose prevalence drops sharply to just 2%. While not strictly zero, this low figure suggests that children in these households likely received multiple vaccinations, even if Penta-1 was not recorded. Between these two extremes is a group of households where HBRs were reported to exist but were not seen by enumerators during the interview. This group exhibits an intermediate zero-dose prevalence of 32%, reflecting a mixed profile that may include both children with undocumented vaccinations and those truly unvaccinated. Details on the availability of HBRs is further discussed in Section 4.2.2.
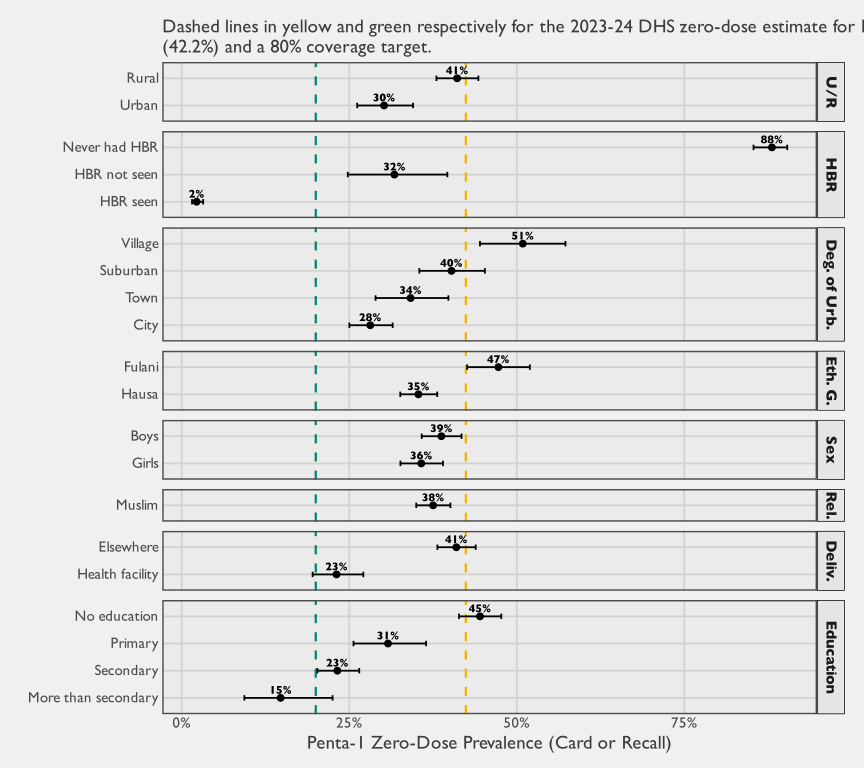
Figure 4.6 compares different approaches to estimating zero-dose prevalence—specifically, children who have received no vaccines by a given age—using data from 15 LGAs in Kano. The yellow line shows the true zero-dose curve based on whether a child had received any vaccine (reported via card or recall), while the green line captures zero-dose status using only Penta-1 as a proxy (Gavi definition).4 These are overlaid with a black line representing the ratio between the two approaches. After an initial period of divergence, the ratio stabilizes: by six months, the Penta-1 proxy consistently captures about 88% of true zero-dose children. This means that while Penta-1 is not a perfect proxy, it provides a reliable approximation for identifying zero-dose status beyond early infancy.
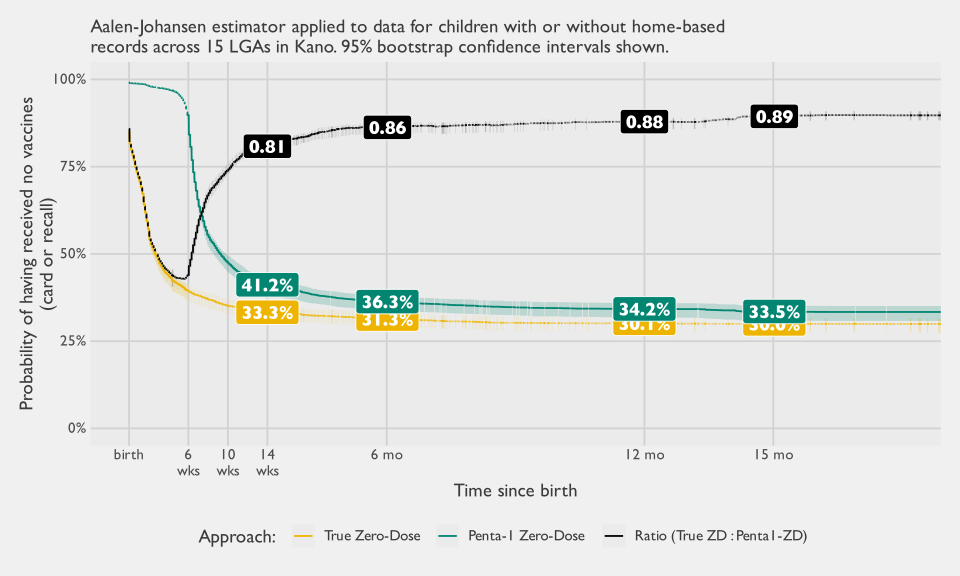
The shape of the curves in Figure 4.6 also reveals a key dynamic in vaccination uptake. Most of the decline in the probability of being zero-dose occurs by 14 weeks—the window for timely receipt of Penta-1 and other early childhood vaccines. After this point, the curves flatten, and by six months, the proportion of children remaining zero-dose becomes relatively stable. This suggests that most zero-dose children are effectively determined in the early postnatal period, with few corrections (catch-up vaccinations) occurring later. Consequently, expanding surveillance or estimation beyond the commonly used 12–23 month age group to include children aged 6–11 months offers meaningful statistical advantages without compromising much in terms of representativeness.
From a practical standpoint, expanding the analytic window to include 6–23-month-olds yields a roughly 50% increase in sample size, which directly improves statistical power and precision. While 12–23 months remains a standard reporting group, the minimal change in zero-dose prevalence after six months—as shown in the chart—means the 6–23-month population can serve as a robust alternative or supplement. Especially in contexts where screening for zero-dose status is logistically or financially intensive, this broader window can enhance efficiency, allowing health planners to make more confident estimates and detect more nuanced patterns across population subgroups.
4.2.3.3.1 Zero-Dose Hotspots
This section aims to identify geographic hotspots of zero-dose children. For this hotspot analysis, we define zero-dose as the absence of the first dose of pentavalent vaccine (Penta-1). To increase the precision of our spatial estimates, we expand the domain of analysis from children 12-23 months to include children aged 6–23 months. This larger sample improves precision and statistical power, particularly when identifying local hotspots within highly disaggregated geographic areas. As the zero-dose rates have been shown not to change materially after the first six months of life Figure 4.6, the hotspots identified on a 6-23 cohort are likely to be nearly identical to hotspots for the 12-23 cohort.
There are multiple ways to conceptualize and detect zero-dose hotspots, each capturing different facets of the problem. One approach focuses on prevalence, using indicator smoothing techniques5 to estimate the proportion of zero-dose children across geographic space. This method highlights areas with a high local burden, yet often identifies areas that are typically sparsely populated and may have far fewer zero-dose children compared to urban areas with modest zero-dose prevalence. An alternative approach examines the absolute number of zero-dose children by generating a smoothed density surface that estimates the number of zero-dose children per hectare. This more commonly draws attention to densely populated settings, such as urban centers, where even moderate prevalence rates can result in a large number of unvaccinated children.
As shown in Figure 4.7, the prevalence and count of zero dose children tends to be positively correlated at the ward level (\(r = 0.55\)): When zero-dose prevalence is high, the total number of children also tends to be high. While this pattern holds for ward-level aggregates, the reverse can sometimes be found when plotting highly granular maps, as sparsely populated areas typically have few zero-dose children but a high prevalence of zero dose children. The difference is explained by the fact that the ward-level estimates use a weighted approach where dense urban centers count for a lot more in the aggregate, whereas mapping approaches showcase many areas with fewer inhabitants.
This implies that these two perspectives–prevalence and absolute burden– can move together but do not necessarily coincide, and neither should be viewed as universally superior. Rather, they offer complementary insights for program planning and resource targeting: one highlights where the proportion of missed children is greatest, while the other shows where the total number of missed children is highest.
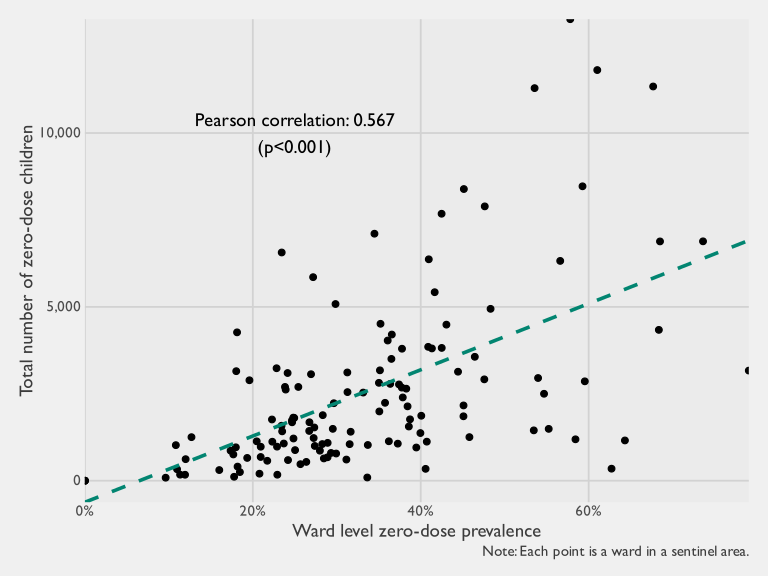
4.2.3.3.1.1 Gaya
A logical entry point for identifying zero-dose hotspots is a tabulation of the zero-dose prevalence at the administrative ward level. Focusing on the expanded age group of children aged 6–23 months yields estimates with moderate, yet acceptable, precision for comparing areas below the LGA level. Table 4.54 displays ward-level estimates for Gaya LGA, ranked by zero-dose prevalence from highest to lowest. The “Estimated Total” column shows the total number of children aged 6–23 months residing in each ward. Balan Ward stands out with the highest zero-dose prevalence at 55%. Shagogo Ward, though not as extreme, also exceeds the LGA average of 36%, with 44% of children unvaccinated with Penta-1. Conversely, wards such as Gaya South and Wudilawa demonstrate relatively high coverage, with substantially fewer zero-dose children.
Proportiona | MOE (Prop) | 95% CI | LCB | UCB | DEFF | Estimated Total | MOE (Total) | Unweighted Cases | Domain Sample Size | |
|---|---|---|---|---|---|---|---|---|---|---|
Balan | 54.7% | ±5.9 | (48.7; 60.5) | 49.7% | 59.6% | 1.47 | 2,500 | ±420 | 216 | 403 |
Shagogo | 44.4% | ±4.6 | (39.9; 49.1) | 40.6% | 48.3% | 1.30 | 3,135 | ±463 | 244 | 594 |
Kazurawa | 38.7% | ±5.7 | (33.2; 44.6) | 34.0% | 43.6% | 1.37 | 1,765 | ±322 | 163 | 385 |
Maimakawa | 37.4% | ±4.5 | (33.0; 42.0) | 33.7% | 41.3% | 1.27 | 2,770 | ±425 | 211 | 562 |
Gaya North | 36.5% | ±4.4 | (32.2; 41.0) | 32.9% | 40.3% | 1.70 | 3,503 | ±585 | 311 | 793 |
Gamarya | 33.7% | ±7.1 | (27.0; 41.2) | 28.0% | 39.9% | 1.31 | 1,027 | ±238 | 89 | 225 |
Gamoji | 31.5% | ±7.6 | (24.5; 39.6) | 25.5% | 38.2% | 1.63 | 1,051 | ±322 | 68 | 238 |
Kademi | 29.6% | ±4.8 | (25.1; 34.6) | 25.8% | 33.8% | 1.78 | 2,229 | ±468 | 182 | 631 |
Wudilawa | 27.4% | ±5.7 | (22.1; 33.5) | 22.9% | 32.4% | 1.25 | 999 | ±251 | 75 | 296 |
Gaya South | 24.8% | ±4.4 | (20.7; 29.5) | 21.4% | 28.7% | 1.17 | 1,214 | ±235 | 116 | 444 |
All | 36.3% | ±1.7 | (34.6; 38.1) | 34.9% | 37.8% | 1.53 | 20,195 | ±1,275 | 1,675 | 4,571 |
aProportion of zero-dose children out of all infants 6-23 months | ||||||||||
Abbreviations: CI = Confidence Interval; MOE = Margin of Error; LCB = Lower Confidence Bound; UCB = Upper Confidence Bound; DEFF = Design Effect; Pearson's Chi-square test with a Rao & Scott adjustment: F = 9.335 (p<0.001) | ||||||||||
The coverage map in Figure 4.8 presents a smoothed surface highlighting areas with high zero-dose prevalence. Dark purple regions indicate rates above 70%, often in sparsely populated areas. This map helps to identify local hotspots that may span across ward boundaries or exist as smaller pockets within them. In contrast, areas shown in lime green and yellow represent zones with high vaccination coverage—also exceeding 70%.
Notable high-coverage areas include the northern border of Gaya (south of the Kafi settlement), Niima Yamma, the eastern edge of Balan, and the southern part of Shagogo ward near the Alkalawa settlement. In the southeast of the LGA, coverage hotspots appear in Kazurawa ward (outside Gidan Geri) and in Maimakawa ward, particularly in the settlements of Hausawa Hadi, Hausawa Magaji Gari Mai Unguwa, and Kurta.
While these coverage hotspots are important, the zero-dose density map in Figure 4.9 provides a complementary view by identifying areas where large numbers of zero-dose children are concentrated. It highlights the neighboring settlements of Zango Layin Gidan Mai Unguwar and Unguwar Mahaukaci as significant clusters. Despite relatively high coverage rates, the high population density in these areas means that even a small proportion of zero-dose children translates into a substantial absolute number of unvaccinated children. Looking at the Lower Confidence Bound (LCB), none of the wards in Gaya LGA can confidently be said to have a zero-dose rate above 50% (a commonly-chosen threshold in Lot Quality Assurance Sampling (LQAS) studies).
Figure 4.10 combines the two perspectives of prevalence and absolute burden. Areas in green identify places where the Penta-1 prevalence is below 40%. Areas in yellow identify places with at least five zero-dose children per hectare.6
4.2.3.3.1.2 Nassarawa
As a distinctly urban LGA, Nassarawa stands apart from the other two sentinel LGAs in many regards. As discussed in earlier sections, the area generally has a lower zero-dose rate. As shown in Table 4.55, all its administrative wards have a Penta-1 zero dose rate of 32% or lower, with some wards like Gama even reaching a particularly low prevalence of 11%. Hotoro North stands out as a ward that has a zero-dose prevalence that is on the higher end for the LGA, as well as being a ward with a markedly higher absolute count of zero-dose children aged 6-23 months (~3000). It should be noted that uncertainty around these ward-level estimates is materially higher because Nassarawa yielded a smaller sample compared to the other sentinel LGAs due to its lower birth rate and lower survey response rate. The Krigging techniques used in estimating the geographic maps also reveal that the spatial correlation in Nassarawa is virtually nil: past 10 meters, distance to neighbouring areas does not correlate any more or less to the zero-dose status of the child. Combined, this means that the spatial data is not as informative as other sentinel areas at estimating where zero-dose rates are particularly high or low in the LGA.
Proportion | MOE (Prop) | 95% CI | LCB | UCB | DEFF | Estimated Total | MOE (Total) | Unweighted Cases | Domain Sample Size | |
|---|---|---|---|---|---|---|---|---|---|---|
Dakata | 31.1% | ±11.1 | (21.2; 43.1) | 22.7% | 41.1% | 1.09 | 608 | ±252 | 23 | 77 |
Hotoro South | 28.5% | ±9.8 | (19.8; 39.1) | 21.0% | 37.3% | 1.16 | 640 | ±251 | 30 | 99 |
Tudun Murtala | 27.2% | ±6.6 | (21.1; 34.4) | 22.1% | 33.1% | 1.14 | 1,228 | ±360 | 58 | 200 |
Hotoro North | 26.9% | ±4.3 | (22.8; 31.5) | 23.5% | 30.7% | 1.11 | 3,063 | ±594 | 120 | 449 |
Kawaji | 26.7% | ±5.7 | (21.4; 32.8) | 22.2% | 31.8% | 1.06 | 1,681 | ±407 | 69 | 250 |
Gwagwarwa & Kaura Gojea | 22.9% | ±5.2 | (18.2; 28.5) | 18.9% | 27.6% | 1.31 | 1,694 | ±445 | 76 | 337 |
Tudun Wada & Giginyua | 22.3% | ±5.4 | (17.4; 28.2) | 18.1% | 27.2% | 1.30 | 1,933 | ±517 | 66 | 301 |
Gama & Gawunaa | 10.7% | ±5.4 | (6.3; 17.4) | 6.9% | 16.1% | 1.23 | 417 | ±225 | 18 | 158 |
All | 24.3% | ±2.1 | (22.3; 26.5) | 22.6% | 26.1% | 1.17 | 11,265 | ±1,113 | 460 | 1,871 |
Abbreviations: CI = Confidence Interval; MOE = Margin of Error; LCB = Lower Confidence Bound; UCB = Upper Confidence Bound; DEFF = Design Effect; Pearson's Chi-square test with a Rao & Scott adjustment: F = 2.85 (p=0.006) | ||||||||||
aIn this table, administrative wards with small sample sizes have been collapsed with neighbouring wards. | ||||||||||
Nevertheless, some spatial insights can be gleaned from a mapping exercise. Figure 4.11 suggest that on a relative basis, the prevalence of zero dose children is slightly lower in the eastern part of the LGA. The density map Figure 4.12 helps highlight neighborhoodss with large numbers of zero-dose children. We observe a strong concentration of zero-dose children per hectare in the heart of Kaura Goje and Gama settlements in the northern part of the LGA. Because the prevalence map is relatively uniform, this concentration in zero-dose child density is likely largely a function of the population density of these areas. The south-eastern part of Nassarawa also has a relatively higher-than-average spatial concentration of zero-dose children, particularly in Hotoro North and the easternmost part of Giginyu ward. Figure 4.13 combines these two perspectives into a single plot based on the arbitrary cutoffs of areas with less than 75% coverage and areas with a zero-dose density per hectare greater than 10 children.
4.2.3.3.1.3 Gabasawa
With an average zero-dose prevalence of 30.7%, Gabasawa LGA has wards that range within roughly 10 percentage points of this average. The wards of Tarauni, Yautar Arewa, Joda, and Yautar Kudu stand well above this LGA average, as shown in Table 4.56. Karmami ward and Zugachi ward have the lowest zero-dose prevalence, at 20.5% and 22.3% respectively. In terms of estimated absolute numbers, Yautar Kudu and Mekiya are likely to capture the most zero-dose children of all the ward in Gabasawa.
Proportion | MOE (Prop) | 95% CI | LCB | UCB | DEFF | Estimated Total | MOE (Total) | Unweighted Cases | Domain Sample Size | |
|---|---|---|---|---|---|---|---|---|---|---|
Tarauni | 41.4% | ±7.1 | (34.5; 48.6) | 35.6% | 47.4% | 1.37 | 948 | ±192 | 109 | 256 |
Yautar Arewa | 40.1% | ±5.8 | (34.5; 45.9) | 35.3% | 45.0% | 1.55 | 1,869 | ±405 | 186 | 436 |
Joda | 38.4% | ±5.3 | (33.3; 43.8) | 34.1% | 43.0% | 1.42 | 2,139 | ±380 | 182 | 465 |
Yautar Kudu | 38.3% | ±4.0 | (34.3; 42.4) | 34.9% | 41.7% | 1.24 | 2,647 | ±369 | 266 | 691 |
Mekiya | 31.3% | ±4.6 | (26.9; 36.0) | 27.6% | 35.3% | 1.67 | 2,548 | ±466 | 212 | 656 |
Garun Danga | 27.3% | ±4.7 | (22.9; 32.2) | 23.6% | 31.4% | 1.30 | 1,531 | ±303 | 130 | 460 |
Gabasawa | 26.7% | ±3.8 | (23.1; 30.7) | 23.6% | 30.1% | 1.09 | 1,431 | ±241 | 159 | 557 |
Zakirai | 25.7% | ±6.0 | (20.1; 32.1) | 21.0% | 31.0% | 0.93 | 475 | ±123 | 53 | 192 |
Yumbu | 25.0% | ±7.9 | (18.0; 33.8) | 19.0% | 32.2% | 2.39 | 880 | ±343 | 72 | 277 |
Zugachi | 22.3% | ±4.7 | (18.0; 27.3) | 18.6% | 26.5% | 1.36 | 1,121 | ±253 | 104 | 418 |
Karmami | 20.5% | ±4.0 | (16.7; 24.8) | 17.3% | 24.1% | 1.33 | 1,133 | ±240 | 101 | 514 |
All | 30.7% | ±1.6 | (29.1; 32.3) | 29.4% | 32.1% | 1.55 | 16,723 | ±1,100 | 1,574 | 4,922 |
Abbreviations: CI = Confidence Interval; MOE = Margin of Error; LCB = Lower Confidence Bound; UCB = Upper Confidence Bound; DEFF = Design Effect; Pearson's Chi-square test with a Rao & Scott adjustment: F = 7.748 (p<0.001) | ||||||||||
Figure 4.14 shows that the north-western part of the LGA tends to have the lowest vaccination coverage. Some settlements with higher-than-average zero-dose prevalences include Bariya, Nassarawar Yarzabaina, Nassarawar Yauta, and Yautar Arewa. In other parts of Gabassawa, Badawa Danduwa settlement appears to have lower vaccination coverage, as well as Binoni in the south. However, many of the low-coverage areas appear to be in the rural areas surrounding villages, as shown by Figure 4.16. On the basis of geographic density, Karami and Kumbotso settlments are likely to have concentrations of unvaccinated children, as well as the stretch from Zugachi to Gunduwa. Gumawa in the center of the LGA also appears to have higher concentrations, as well as Kumbo, Mekiya, Ballagaza, and Nasarawa settlement (to the south of Tahade). Many of these areas correlate strongly with areas that have the highest population density in general.
In Gabasawa LGA, children’s Penta-1 vaccination status shows signs of spatial clustering– children who live near each other are more likely to have similar vaccination outcomes. This spatial correlation extends up to about 1.6 kilometers, meaning that within this range, households tend to show more similar vaccination patterns the closer they are to each other. Beyond that distance, the relationship weakens, and vaccination status of other households has no greater bearing on the likelihood that a given household is zero-dose. At the same time, there’s still considerable variability even between neighbouring households (a high so-called nugget effect). This suggests that while location plays a role, other factors– such as household characteristics or community-specific dynamics– also influence whether a child is vaccinated.
4.2.3.3.1.4 Non-Sentinel Areas
The identification of non-sentinel hotspots proceeds in a different manner. In contrast to the three sentinel LGAs where buildings were sampled directly in the first stage, non-sentinel LGAs were preceded by an additional level of cluster sampling: gridded Enumeration Areas (EAs) were selected first, followed by sub-sampling of buildings. Although non-sentinel estimates at the aggregate level are approximately unbiased, fine-grained analysis is not appropriate for identifying geographic hotspots as a result of this different sampling approach. Indeed, sampled data for non-sentinel zones are highly clustered and some wards would have zero data if plotted on a geographic map. Consequently, the analysis of zero-dose hotspots in non-sentinel areas is limited to identifying sampled EAs with surprisingly high zero-dose prevalence.
To increase statistical power for detecting unusually high rates, Table 4.57 below expands the domain of analysis to all children aged 6–23 months. This boosts the sample size by roughly 50% in each EA. An unweighted one-sided binomial test is used to assess how likely it would be to find the recorded zero-dose prevalence at least as high as the one observed, under the null hypothesis that the EA has the same Penta-1 zero-dose rate as the weighted LGA average. This makes a simplifying assumptions that the data within the EA behave as though they were drawn as a simple random sample, and that the propensity for a child to be vaccinated is independent of all other children in the EA. An area is flagged if such the observed vaccination prevalence (or a lower prevalence) would occur by chance alone in fewer than 1 out of 10 repeated samples (i.e., a \(p\)-value below 0.1 in Table 4.57). Geographic coordinates are provided which identify the geometric median of all children assessed in the EA.
For example, looking at the first few rows of the table, we can see that EA #8894 is flagged within Gediya Ward in Sumaila LGA. Its weighted estimated Penta-1-based zero-dose prevalence is 96.8%, based on 21 children in the cluster out of 22 aged 6-23 months who showed no evidence of receiving a Penta-1 vaccine (card or recall). This rate is considered very high, given that the LGA-wide zero-dose rate is 39.6%. The adjusted p-values tells us we would expect such a result very infrequently—less than 0.1 percent of the time—if this cluster had a zero-dose rate equal to 39.6%. Because this is so far from the LGA average, this EA is flagged as a zone where there is unusually low coverage, and the coordinates (11.2703, 8.9393) tell us the latitude and longitude of this zone if we wanted to send teams to this area to target households with catch-up interventions.
Area | EA | Coordinates (Lat, Lon) | Weighted | Unweighted | p-value | |||
|---|---|---|---|---|---|---|---|---|
Prop.a | Prop. | ZD Casesd | ne | Unadjustedb | Adjustedc | |||
Sumaila LGA | 39.5% | |||||||
Gediya | #8894 | 11.2703, 8.9392 | 96.8% | 95.2% | 20 | 21 | <0.001 | <0.001 |
Magami | #9020 | 11.203, 8.8566 | 91.1% | 88.9% | 16 | 18 | <0.001 | <0.001 |
Masu | #9069 | 11.2277, 8.8784 | 86.3% | 91.7% | 11 | 12 | <0.001 | 0.001 |
Masu | #9101 | 11.145, 8.8327 | 73.9% | 76.5% | 13 | 17 | 0.002 | 0.006 |
Magami | #9008 | 11.2504, 9.0033 | 73.1% | 76.2% | 16 | 21 | <0.001 | 0.003 |
Sitti | #9337 | 11.305, 8.7992 | 65.0% | 63.0% | 17 | 27 | 0.012 | 0.024 |
Garfa | #8739 | 11.5364, 8.9981 | 61.2% | 56.0% | 14 | 25 | 0.071 | 0.079 |
Kiru LGA | 39.1% | |||||||
Yalwa | #5382 | 11.4369, 8.2005 | 100.0% | 100.0% | 14 | 14 | <0.001 | <0.001 |
Yalwa | #5385 | 11.4567, 8.169 | 82.8% | 94.1% | 16 | 17 | <0.001 | <0.001 |
Yalwa | #5438 | 11.4586, 8.1982 | 61.7% | 62.2% | 23 | 37 | 0.004 | 0.009 |
Kumbotso LGA | 22.8% | |||||||
Unguwar Rimi | #7310 | 11.9096, 8.5687 | 62.7% | 50.0% | 5 | 10 | 0.055 | 0.065 |
Kureken Sani | #6717 | 11.8839, 8.5745 | 59.0% | 58.1% | 18 | 31 | <0.001 | <0.001 |
Naibawa | #6976 | 11.9063, 8.5399 | 52.3% | 50.0% | 7 | 14 | 0.024 | 0.038 |
Chiranchi | #5838 | 11.9296, 8.4746 | 51.7% | 50.0% | 6 | 12 | 0.036 | 0.049 |
Garun Gawa | #6606 | 11.9238, 8.4809 | 41.5% | 42.9% | 6 | 14 | 0.077 | 0.084 |
Takai LGA | 40.8% | |||||||
Kachako | #9709 | 11.5684, 9.3431 | 84.4% | 75.8% | 25 | 33 | <0.001 | <0.001 |
Takai | #9851 | 11.5451, 9.0805 | 78.2% | 70.6% | 24 | 34 | <0.001 | 0.002 |
Gezawa LGA | 40.3% | |||||||
Gawo | #3783 | 12.0051, 8.7724 | 68.5% | 68.6% | 24 | 35 | <0.001 | 0.003 |
Mesar Tudu | #3918 | 12.1325, 8.7427 | 67.7% | 62.0% | 31 | 50 | 0.002 | 0.005 |
Dawakin Kudu LGA | 40.2% | |||||||
Yan Barau | #1872 | 11.8603, 8.6294 | 88.4% | 70.0% | 7 | 10 | 0.056 | 0.065 |
Dosan | #1541 | 11.7908, 8.6908 | 79.6% | 80.0% | 12 | 15 | 0.002 | 0.006 |
Tsakuwa | #1749 | 11.7569, 8.6409 | 76.8% | 71.4% | 15 | 21 | 0.004 | 0.009 |
Dawaki | #1342 | 11.8616, 8.6054 | 61.9% | 62.2% | 23 | 37 | 0.006 | 0.012 |
Tsakuwa | #1750 | 11.7901, 8.6261 | 58.7% | 58.8% | 10 | 17 | 0.095 | 0.097 |
Bebeji LGA | 48.4% | |||||||
Gwarmai | #258 | 11.4882, 8.3487 | 64.9% | 69.2% | 18 | 26 | 0.026 | 0.040 |
Gwarmai | #230 | 11.4721, 8.2518 | 62.5% | 62.5% | 30 | 48 | 0.035 | 0.049 |
Kuki | #349 | 11.3777, 8.3508 | 59.5% | 73.0% | 27 | 37 | 0.002 | 0.006 |
Dambatta LGA | 30.1% | |||||||
Kore | #1087 | 12.36, 8.746 | 61.1% | 52.9% | 9 | 17 | 0.041 | 0.054 |
Saidawa | #1121 | 12.3885, 8.6312 | 48.2% | 55.0% | 11 | 20 | 0.017 | 0.032 |
Kore | #1053 | 12.4189, 8.7243 | 43.1% | 42.4% | 14 | 33 | 0.090 | 0.095 |
Dawakin Tofa LGA | 26.3% | |||||||
Dawanau | #2141 | 12.0854, 8.4335 | 49.2% | 50.0% | 9 | 18 | 0.027 | 0.040 |
Ganduje | #2228 | 12.2161, 8.4392 | 45.1% | 52.9% | 9 | 17 | 0.018 | 0.032 |
Tudun Wada LGA | 50.6% | |||||||
Sabon Gari | #10870 | 11.2548, 8.3641 | 69.1% | 67.9% | 19 | 28 | 0.049 | 0.063 |
Baburi | #10456 | 11.3481, 8.7209 | 68.4% | 69.7% | 23 | 33 | 0.020 | 0.036 |
Tarauni LGA | 18.3% | |||||||
Hotoro | #10192 | 11.9625, 8.5742 | 36.0% | 35.7% | 10 | 28 | 0.022 | 0.038 |
Ungogo LGA | 27.6% | |||||||
Rijiyar Zaki | #11680 | 11.9846, 8.4438 | 66.6% | 54.5% | 6 | 11 | 0.054 | 0.065 |
Gayawa | #11246 | 12.0508, 8.5665 | 55.2% | 57.1% | 4 | 7 | 0.097 | 0.097 |
aEA zero-dose prevalence: proportion of children aged 6-23 months who have not received a Penta-1 vaccine (card or recall). | ||||||||
bThe unadjusted p-value is the probability that at least x zero-dose children would be observed out of n cases in the EA, under the assumption that the cluster has a true zero-dose rate equal to the LGA-average, r. Mathematically, this is the binomial probability P(X ≥ x | n, r). | ||||||||
cThe adjusted p-value inflates the raw p-value to account for repeated testing, using the Benjami-Hochberg procedure that controls for the False Discovery Rate. Adjustment is applied after sub-setting cases to those where the unadjusted p-value is 0.1 or lower. | ||||||||
dNumber of Penta-1 zero-dose children found in the EA | ||||||||
eNumber of children aged 6-23 assessed in the EA | ||||||||
4.2.3.4 Fully-Immunized Children
The concept of a fully immunized child provides a standardized way to assess completion of essential childhood vaccinations for children 12-23 months old. It captures whether children have received the full sequence of key antigens required for protection against major vaccine-preventable diseases, and serves as a central indicator for monitoring routine immunization program performance.
The specific definition of fully immunized can vary depending on the set of antigens included and national program timelines. In this chapter, we begin by presenting the basic antigen approach, in which a child must receive at least:
- One dose of BCG vaccine;
- Three doses of polio vaccine given as OPV, Inactivated Polio Vaccine (IPV), or a combination of OPV and IPV7;
- Three doses of DPT-containing vaccine (pentavalent); and
- One dose of MCV
This contrasts with the stricter national schedule approach, which follows the Nigeria immunization schedule for children aged 12–23 months. To be considered fully-immunized under this standard, a child must have received:
- One dose of BCG
- One (birth) dose of HepB
- Three doses of DPT (pentavalent)
- Four doses of OPV
- Two doses of IPV
- Three doses of PCV vaccine
- Three doses of RV vaccine
- One dose of MCV vaccine
- One dose of YF vaccine
- One dose of meningitis vaccine
The 2023-24 NDHS–often used as a benchmark–did not include rotavirus immunizations in prevalences of calculations. This is because its data collection overlapped with the tail end of the RV roll-out in phases in August and October 2022. Since not all children age 12–23 months were eligible for RV at the time of the NDHS survey, their estimates excluded them. The current zero-dose study took place later and did not have this problem. For comparability with the NDHS, variants with and without RV are presented in Table 4.59 and Table 4.60. As the present only collected data on infants up to 23 months, our report does not present the NDHS fully vaccinated cohort for 24–35 months, which includes the second measles dose. Including rotavirus, the proportion of children fully vaccinated according to the national schedule is 34.8%.
Nassarawa LGA, in spite of having lowest proportion of zero-dose children out of the three sentinel LGAs, nevertheless has a far lower proportion of fully-immunized children (national schedule) than Gaya or Gabassawa. This is mainly explained by the fact that children in this state have high coverage for basic antigens, but much lower coverage for YF and meningitis.
Proportion | MOE (Prop) | 95% CI | LCB | UCB | DEFF | Estimated Total | MOE (Total) | Unweighted Cases | Domain Sample Size | |
|---|---|---|---|---|---|---|---|---|---|---|
Nassarawa | 66.2% | ±2.7 | (63.4; 68.9) | 63.9% | 68.5% | 1.11 | 21,126 | ±1,644 | 834 | 1,283 |
Gabasawa | 61.3% | ±2.1 | (59.3; 63.4) | 59.6% | 63.0% | 1.43 | 21,165 | ±1,132 | 1,856 | 3,092 |
Gaya | 58.7% | ±2.2 | (56.6; 60.9) | 56.9% | 60.5% | 1.47 | 21,067 | ±1,121 | 1,712 | 2,912 |
Non-sentinel LGAs | 56.0% | ±3.2 | (52.8; 59.2) | 53.4% | 58.7% | 3.81 | 286,510 | ±27,614 | 2,071 | 3,608 |
All | 57.0% | ±2.7 | (54.3; 59.6) | 54.8% | 59.2% | 8.10 | 349,868 | ±27,771 | 6,473 | 10,895 |
Abbreviations: CI = Confidence Interval; MOE = Margin of Error; LCB = Lower Confidence Bound; UCB = Upper Confidence Bound; DEFF = Design Effect; Pearson's Chi-square test with a Rao & Scott adjustment: F = 11.2 (p<0.001) | ||||||||||
Proportion | MOE (Prop) | 95% CI | LCB | UCB | DEFF | Estimated Total | MOE (Total) | Unweighted Cases | Domain Sample Size | |
|---|---|---|---|---|---|---|---|---|---|---|
Non-sentinel LGAs | 37.3% | ±3.1 | (34.3; 40.4) | 34.8% | 39.9% | 3.75 | 190,755 | ±20,198 | 1,416 | 3,608 |
Gabasawa | 25.8% | ±1.9 | (23.9; 27.7) | 24.2% | 27.4% | 1.51 | 8,897 | ±757 | 758 | 3,092 |
Gaya | 22.9% | ±1.7 | (21.2; 24.7) | 21.5% | 24.4% | 1.29 | 8,216 | ±673 | 681 | 2,912 |
Nassarawa | 16.4% | ±2.3 | (14.2; 18.8) | 14.5% | 18.4% | 1.30 | 5,224 | ±802 | 206 | 1,283 |
All | 34.7% | ±2.6 | (32.2; 37.3) | 32.6% | 36.9% | 8.15 | 213,092 | ±20,206 | 3,061 | 10,895 |
Abbreviations: CI = Confidence Interval; MOE = Margin of Error; LCB = Lower Confidence Bound; UCB = Upper Confidence Bound; DEFF = Design Effect; Pearson's Chi-square test with a Rao & Scott adjustment: F = 74.198 (p<0.001) | ||||||||||
Proportion | MOE (Prop) | 95% CI | LCB | UCB | DEFF | Estimated Total | MOE (Total) | Unweighted Cases | Domain Sample Size | |
|---|---|---|---|---|---|---|---|---|---|---|
Non-sentinel LGAs | 38.0% | ±3.1 | (35.0; 41.2) | 35.4% | 40.7% | 3.88 | 194,480 | ±20,465 | 1,444 | 3,608 |
Gabasawa | 26.3% | ±1.9 | (24.4; 28.2) | 24.7% | 27.9% | 1.50 | 9,066 | ±762 | 773 | 3,092 |
Gaya | 23.2% | ±1.7 | (21.5; 25.0) | 21.7% | 24.7% | 1.29 | 8,312 | ±677 | 688 | 2,912 |
Nassarawa | 16.6% | ±2.3 | (14.4; 19.0) | 14.7% | 18.6% | 1.29 | 5,292 | ±801 | 209 | 1,283 |
All | 35.4% | ±2.6 | (32.8; 38.0) | 33.2% | 37.6% | 8.40 | 217,150 | ±20,468 | 3,114 | 10,895 |
Abbreviations: CI = Confidence Interval; MOE = Margin of Error; LCB = Lower Confidence Bound; UCB = Upper Confidence Bound; DEFF = Design Effect; Pearson's Chi-square test with a Rao & Scott adjustment: F = 76.33 (p<0.001) | ||||||||||
The survey finds that 57% of children aged 12–23 months are fully vaccinated for basic antigens. This rate is considerably higher than the 35.8% for Kano state estimate from the 2023-24 NDHS. The explanations may be considered. First, the inferential population of this study only captures 15 LGAs out of 40 in Kano state. Second, the NDHS estimate may have more sampling error (only 271 children assessed). Similarly, the estimate of fully immunized children (without rotavirus) in this survey is 35%–considerably higher than the NDHS estimate of 13.6% for Kano. Finally, fully immunized child rates tend to fluctuate more than individual antigen coverage or zero-dose measures because they depend on a child receiving all required vaccines in the schedule. Even small shifts in coverage for a single antigen—such as a stockout, delayed introduction, or change in eligibility—can cause large swings in FIC estimates across time a space.
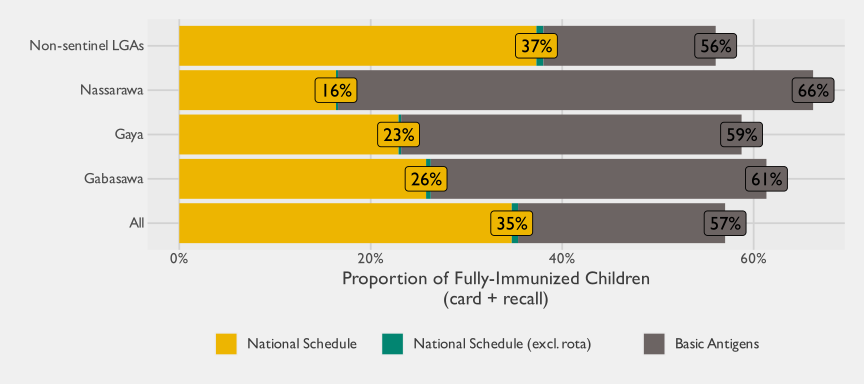
Detailed disaggregations by different LGA are presented in Section A.1.2. Related insights on vaccination drop-out are also discussed in Section 4.2.4.
4.2.3.4.1 Predictors of Vaccination Status (Ordinal Ladder)
A binary fully-immunized indicator treats two very different children the same: the one who has missed every antigen and the one who has received every basic antigen but not the full national schedule. To capture the gradient between them, we built a four-level ordinal vaccination status, ordered from least to most immunized:
- Zero-dose — no documented antigens
- Partially immunized — at least one antigen, but not all basic antigens
- Basic antigens — BCG, three DPT, full polio sequence, and MCV-1, but not the full national schedule
- National schedule — the full Nigerian schedule (BCG, HepB birth dose, three DPT, full polio sequence, IPV, PCV, RV, MCV-1, YF, and meningitis)
We do not split the top level by MCV-2 status: MCV-2 is scheduled at 15 months, and many children in the 12–23 month cohort are not yet age-eligible. The analysis covers the full 12–23 month cohort.
The candidate pool has eight background characteristics: sex of child, birth order, caregiver education, household wealth quintile, settlement type, place of delivery, ethnic group, and religion. The complete-case sample is 10,300 children.
We use forward-then-backward stepwise selection on a design-weighted proportional-odds regression to pick the model with lowest Akaike Information Criterion (AIC).8
Step | Action | Variable | Wald χ² | df | ΔAIC |
|---|---|---|---|---|---|
1 | Add | Wealth quintile | 79.82 | 4 | -71.82 |
2 | Add | Caregiver education | 30.61 | 3 | -24.61 |
3 | Add | Settlement type | 16.12 | 3 | -10.12 |
4 | Add | Place of delivery | 13.27 | 1 | -11.27 |
5 | Add | Ethnic group | 9.15 | 2 | -5.15 |
6 | Add | Sex of child | 5.39 | 1 | -3.39 |
7 | Add | Religion | 2.04 | 1 | -0.04 |
8 | Drop | Wealth quintile | 2.86 | 4 | -5.14 |
Selection retained 6 of the 8 candidate predictors. Wealth quintile and birth order were dropped because they did not improve fit enough to be kept: wealth quintile is plausibly captured by caregiver education and settlement type — both retained — and birth order adds little once the other predictors are in.
Term | Estimate | exp(Estimate) | SE(Estimate) | z-statistic | p-value | FDR p-value |
|---|---|---|---|---|---|---|
Threshold cutpoints (intercepts) | ||||||
Zero-dose | Partially immunized | 0.118 | 1.13 | 0.156 | 0.761 | 0.446 | |
Partially immunized | Basic antigens | -0.339 | 0.71 | 0.157 | -2.162 | 0.031 | |
Basic antigens | National schedule | -1.289 | 0.28 | 0.161 | -8.007 | <0.001 | |
Caregiver education | ||||||
Primary | 0.216 | 1.24 | 0.115 | 1.874 | 0.061 | 0.084 |
Secondary | 0.676 | 1.97 | 0.114 | 5.922 | <0.001 | <0.001 |
More than secondary | 0.877 | 2.40 | 0.202 | 4.339 | <0.001 | <0.001 |
Settlement type | ||||||
Suburban | 0.313 | 1.37 | 0.184 | 1.702 | 0.089 | 0.109 |
Town | 0.603 | 1.83 | 0.181 | 3.329 | <0.001 | 0.002 |
City | 0.290 | 1.34 | 0.193 | 1.507 | 0.132 | 0.145 |
Place of delivery | ||||||
Health facility | 0.351 | 1.42 | 0.094 | 3.727 | <0.001 | <0.001 |
Ethnic group | ||||||
Fulani | -0.273 | 0.76 | 0.104 | -2.619 | 0.009 | 0.019 |
Other | -0.389 | 0.68 | 0.194 | -2.009 | 0.045 | 0.070 |
Sex of child | ||||||
Girls | 0.165 | 1.18 | 0.070 | 2.358 | 0.018 | 0.034 |
Religion | ||||||
Non-Muslim | 0.281 | 1.32 | 0.198 | 1.420 | 0.156 | 0.156 |
Reference levels: Caregiver education = No education; Settlement type = Village; Place of delivery = Elsewhere; Ethnic group = Hausa; Sex of child = Boys; Religion = Muslim. | ||||||
The reference categories describe a common low-coverage child: no caregiver education, born outside a health facility, Hausa Muslim, living in a village. For this child the model predicts a 47% chance of being zero-dose, 11% partially immunized, 20% at basic antigens, and 22% on the full national schedule. | ||||||
Caregiver education and settlement type are the largest movers. Children whose caregivers completed at least secondary school sit higher on the ladder than those whose caregivers had no formal education; children in towns or cities sit higher than those in villages. Place of delivery moves children in the same direction — a facility birth is associated with a more complete schedule than birth elsewhere — and ethnic group adds further structure: Fulani and other-ethnic children sit lower on the ladder than Hausa children. Girls sit higher on the ladder than boys — a gap that is small in the raw marginals (boys 32% vs girls 31% zero-dose) but widens once survey weights are applied (35% vs 31%), and which the design-weighted selection step picks up. Religion is retained on AIC grounds, but its average effect is not statistically significant: the non-Muslim group is small (~1% of the sample), and the proportional-odds average hides the strongest threshold-by-threshold heterogeneity of any predictor (see Table 4.63). The directions match the bivariate patterns in Section A.1.2.
The estimates above should be read as averages across thresholds: the proportional-odds model forces each predictor’s effect to be the same at every rung, an assumption that does not hold strictly here.9 Table 4.63 shows what this averaging masks.
The three intercepts also reveal something about the ladder itself. The boundary between partially immunized and basic antigens sits very close to the boundary between zero-dose and partially immunized — less than half the distance from basic antigens to the full national schedule. The partially-immunized rung is therefore a narrow band: small shifts in a child’s circumstances can move them across it in either direction, while completing the final step from basic antigens to the national schedule is a substantially larger jump.
Several patterns emerge from the threshold-specific coefficients. The place-of-delivery effect is roughly three times larger at the zero-dose / partially-immunized cut than at the basic / national cut. A few coefficients (primary education, city settlements, religion) flip sign across the three thresholds, while sex of child and Fulani ethnicity are essentially constant — for those two, the proportional-odds approximation is closer to right.
Religion is the clearest case of threshold heterogeneity: being non-Muslim is strongly associated with climbing out of zero-dose (β ≈ +1.17 at that cut), but the advantage shrinks at higher rungs and reverses slightly at the final step (β ≈ −0.30). The proportional-odds model averages these into a small, near-null coefficient — exactly the pattern the assumption is built to hide.
Term | Zero-dose | Partially | Partially | Basic | Basic | National |
|---|---|---|---|
Caregiver education | |||
Primary | 0.358 | 0.181 | -0.114 |
Secondary | 0.692 | 0.438 | 0.417 |
More than secondary | 1.002 | 0.835 | 0.486 |
Settlement type | |||
Suburban | 0.133 | 0.182 | 0.122 |
Town | 0.474 | 0.534 | 0.329 |
City | 0.277 | 0.188 | -0.112 |
Place of delivery | |||
Health facility | 0.515 | 0.336 | 0.169 |
Ethnic group | |||
Fulani | -0.348 | -0.366 | -0.338 |
Other | -0.012 | -0.007 | -0.096 |
Sex of child | |||
Girls | 0.032 | 0.033 | 0.043 |
Religion | |||
Non-Muslim | 1.168 | 0.520 | -0.303 |
Estimates are unweighted partial-proportional-odds coefficients on the cumulative log-odds scale; positive values raise the odds of falling at or above the listed threshold (i.e., being more immunized). Reference levels and predictor groupings match the headline table above. | |||
4.2.3.5 Pathways Typing Tool
The Pathways Segmentation Tool for Northern Nigeria is a population grouping analysis framework that classifies households in eight types based on shared characteristics and associates them with varying degrees of risk of poor health outcomes (vulnerability) (Pathways n.d.).
The segments are classified using a decision tree that Pathways fit on a set of variables ranging from elements such as types of cooking fuel used, urban/rural designations,10 frequency of TV use, and many other factors.11
Each type is associated with a code, as shown in the first column of Table 4.64. The “U” and “R” letters designate urban and rural households respectively, and the digit portion increases on a range from least vulnerable (1) to most vulnerable (4).
As shown by Table 4.64, 72.9% of the respondents in the survey areas belong to either the “R3.2” or “R2” types. Table 4.65, Table 4.66 and Table 4.67 also show that there are large differences in the frequency and distribution of types from one LGA to another.
Cumulative Proportion | Proportion | MOE (Prop) | 95% CI | LCB | UCB | DEFF | Estimated Total | MOE (Total) | Unweighted Cases | |
|---|---|---|---|---|---|---|---|---|---|---|
Medium-high vulnerability (R3.2) | 37.5% | 37.5% | ±3.7 | (33.9; 41.3) | 34.5% | 40.6% | 28.79 | 414,862 | ±57,941 | 7,136 |
Medium-high vulnerability (U3) | 51.1% | 13.6% | ±2.0 | (11.7; 15.7) | 12.0% | 15.3% | 16.49 | 150,036 | ±24,661 | 2,424 |
Higher vulnerability (U4) | 64.6% | 13.5% | ±2.8 | (11.0; 16.6) | 11.4% | 16.0% | 33.27 | 149,496 | ±31,940 | 2,417 |
Lower vulnerability (R2) | 77.1% | 12.5% | ±1.6 | (10.9; 14.2) | 11.2% | 13.9% | 12.37 | 138,106 | ±18,559 | 2,285 |
Medium-low vulnerability (R3.1) | 85.6% | 8.5% | ±1.3 | (7.2; 9.9) | 7.4% | 9.7% | 11.51 | 93,574 | ±16,511 | 2,387 |
Higher vulnerability (R4) | 90.8% | 5.2% | ±1.0 | (4.3; 6.3) | 4.4% | 6.1% | 10.05 | 57,664 | ±12,314 | 1,029 |
Lower vulnerability (U1) | 95.4% | 4.6% | ±0.9 | (3.8; 5.6) | 3.9% | 5.4% | 9.59 | 50,772 | ±11,119 | 805 |
Medium-low vulnerability (U2) | 99.3% | 3.9% | ±0.7 | (3.2; 4.7) | 3.3% | 4.5% | 7.20 | 42,701 | ±9,381 | 682 |
UNCLASSIFIED | 100.0% | 0.7% | ±0.3 | (0.5; 1.1) | 0.5% | 1.0% | 5.13 | 8,140 | ±2,763 | 206 |
All | 100.0% | 100.0% | 1,105,353 | ±85,311 | 19,371 | |||||
Abbreviations: CI = Confidence Interval; MOE = Margin of Error; LCB = Lower Confidence Bound; UCB = Upper Confidence Bound; DEFF = Design Effect; Domain sample size = 19,371 | ||||||||||
Note: A small proportion of cases are labelled as "unclassified." These represent cases where respondents did not answer key questions necessary for classification into Pathways types. These represent 0.5% of all cases. | ||||||||||
Proportion | MOE (Prop) | 95% CI | LCB | UCB | DEFF | Estimated Total | MOE (Total) | Unweighted Cases | |
|---|---|---|---|---|---|---|---|---|---|
Medium-high vulnerability (R3.2) | 41.2% | ±1.4 | (39.8; 42.7) | 40.1% | 42.4% | 1.09 | 24,713 | ±940 | 2,042 |
Higher vulnerability (U4) | 17.2% | ±0.9 | (16.3; 18.1) | 16.4% | 17.9% | 0.72 | 10,288 | ±559 | 891 |
Medium-low vulnerability (R3.1) | 16.5% | ±1.2 | (15.3; 17.7) | 15.5% | 17.5% | 1.31 | 9,867 | ±729 | 797 |
Lower vulnerability (R2) | 9.1% | ±0.9 | (8.2; 10.1) | 8.4% | 9.9% | 1.36 | 5,472 | ±569 | 427 |
Higher vulnerability (R4) | 6.6% | ±0.8 | (5.8; 7.4) | 5.9% | 7.3% | 1.32 | 3,941 | ±478 | 315 |
Medium-high vulnerability (U3) | 5.2% | ±0.6 | (4.7; 5.9) | 4.8% | 5.8% | 0.95 | 3,140 | ±360 | 286 |
Medium-low vulnerability (U2) | 2.5% | ±0.4 | (2.1; 2.9) | 2.1% | 2.9% | 1.04 | 1,475 | ±262 | 134 |
UNCLASSIFIED | 1.0% | ±0.3 | (0.8; 1.4) | 0.8% | 1.3% | 1.00 | 618 | ±179 | 63 |
Lower vulnerability (U1) | 0.7% | ±0.2 | (0.5; 0.9) | 0.5% | 0.9% | 1.01 | 406 | ±137 | 38 |
All | 100.0% | 99.9% | 100.0% | 59,921 | ±958 | 4,993 | |||
Abbreviations: CI = Confidence Interval; MOE = Margin of Error; LCB = Lower Confidence Bound; UCB = Upper Confidence Bound; DEFF = Design Effect; Domain sample size = 4,993 | |||||||||
Note: A small proportion of cases are labelled as "unclassified." These represent cases where respondents did not answer key questions necessary for classification into Pathways types. These represent 0.5% of all cases. | |||||||||
Proportion | MOE (Prop) | 95% CI | LCB | UCB | DEFF | Estimated Total | MOE (Total) | Unweighted Cases | |
|---|---|---|---|---|---|---|---|---|---|
Medium-high vulnerability (R3.2) | 51.2% | ±1.5 | (49.7; 52.8) | 50.0% | 52.5% | 1.32 | 30,066 | ±1,019 | 2,766 |
Medium-low vulnerability (R3.1) | 20.2% | ±1.2 | (18.9; 21.4) | 19.1% | 21.2% | 1.36 | 11,829 | ±760 | 1,073 |
Lower vulnerability (R2) | 16.1% | ±1.1 | (15.0; 17.2) | 15.2% | 17.1% | 1.29 | 9,452 | ±669 | 875 |
Higher vulnerability (R4) | 7.5% | ±0.8 | (6.8; 8.4) | 6.9% | 8.2% | 1.30 | 4,420 | ±473 | 419 |
Higher vulnerability (U4) | 2.6% | ±0.3 | (2.2; 2.9) | 2.3% | 2.8% | 0.61 | 1,499 | ±193 | 149 |
UNCLASSIFIED | 1.2% | ±0.3 | (0.9; 1.5) | 0.9% | 1.5% | 1.22 | 695 | ±196 | 74 |
Medium-high vulnerability (U3) | 0.6% | ±0.2 | (0.4; 0.8) | 0.5% | 0.8% | 0.77 | 346 | ±105 | 39 |
Medium-low vulnerability (U2) | 0.5% | ±0.2 | (0.3; 0.7) | 0.4% | 0.6% | 0.80 | 283 | ±97 | 33 |
Lower vulnerability (U1) | 0.2% | ±0.1 | (0.1; 0.3) | 0.1% | 0.3% | 0.85 | 90 | ±56 | 10 |
All | 100.0% | 99.9% | 100.0% | 58,682 | ±945 | 5,438 | |||
Abbreviations: CI = Confidence Interval; MOE = Margin of Error; LCB = Lower Confidence Bound; UCB = Upper Confidence Bound; DEFF = Design Effect; Domain sample size = 5,438 | |||||||||
Note: A small proportion of cases are labelled as "unclassified." These represent cases where respondents did not answer key questions necessary for classification into Pathways types. These represent 0.5% of all cases. | |||||||||
Proportion | MOE (Prop) | 95% CI | LCB | UCB | DEFF | Estimated Total | MOE (Total) | Unweighted Cases | |
|---|---|---|---|---|---|---|---|---|---|
Medium-high vulnerability (U3) | 48.4% | ±2.2 | (46.2; 50.6) | 46.5% | 50.3% | 1.21 | 28,023 | ±1,360 | 1,159 |
Higher vulnerability (U4) | 20.7% | ±1.8 | (19.0; 22.6) | 19.2% | 22.3% | 1.24 | 11,998 | ±1,096 | 475 |
Lower vulnerability (U1) | 16.6% | ±1.6 | (15.1; 18.2) | 15.3% | 18.0% | 1.09 | 9,617 | ±902 | 397 |
Medium-low vulnerability (U2) | 13.1% | ±1.6 | (11.6; 14.8) | 11.8% | 14.5% | 1.39 | 7,583 | ±1,069 | 286 |
UNCLASSIFIED | 1.2% | ±0.5 | (0.8; 1.8) | 0.8% | 1.7% | 1.30 | 679 | ±319 | 26 |
All | 100.0% | 99.8% | 100.0% | 57,901 | ±1,097 | 2,343 | |||
Abbreviations: CI = Confidence Interval; MOE = Margin of Error; LCB = Lower Confidence Bound; UCB = Upper Confidence Bound; DEFF = Design Effect; Domain sample size = 2,343 | |||||||||
Note: A small proportion of cases are labelled as "unclassified." These represent cases where respondents did not answer key questions necessary for classification into Pathways types. These represent 0.5% of all cases. | |||||||||
Proportion | MOE (Prop) | 95% CI | LCB | UCB | DEFF | Estimated Total | MOE (Total) | Unweighted Cases | |
|---|---|---|---|---|---|---|---|---|---|
Medium-high vulnerability (R3.2) | 38.8% | ±4.3 | (34.5; 43.2) | 35.2% | 42.5% | 13.52 | 360,082 | ±58,177 | 2,328 |
Higher vulnerability (U4) | 13.5% | ±3.3 | (10.5; 17.2) | 11.0% | 16.6% | 16.01 | 125,711 | ±33,989 | 902 |
Lower vulnerability (R2) | 13.3% | ±2.0 | (11.4; 15.4) | 11.7% | 15.0% | 5.77 | 123,182 | ±18,619 | 983 |
Medium-high vulnerability (U3) | 12.8% | ±2.3 | (10.6; 15.3) | 10.9% | 14.8% | 8.31 | 118,527 | ±26,218 | 940 |
Medium-low vulnerability (R3.1) | 7.7% | ±1.6 | (6.3; 9.5) | 6.5% | 9.2% | 6.01 | 71,879 | ±16,549 | 517 |
Higher vulnerability (R4) | 5.3% | ±1.2 | (4.2; 6.6) | 4.4% | 6.4% | 4.74 | 49,303 | ±12,349 | 295 |
Lower vulnerability (U1) | 4.4% | ±1.1 | (3.4; 5.6) | 3.6% | 5.4% | 4.79 | 40,658 | ±12,238 | 360 |
Medium-low vulnerability (U2) | 3.6% | ±0.9 | (2.8; 4.6) | 2.9% | 4.4% | 3.66 | 33,360 | ±9,481 | 229 |
UNCLASSIFIED | 0.7% | ±0.3 | (0.4; 1.1) | 0.4% | 1.0% | 2.71 | 6,148 | ±3,055 | 43 |
All | 100.0% | 99.9% | 928,850 | ±85,665 | 6,597 | ||||
Abbreviations: CI = Confidence Interval; MOE = Margin of Error; LCB = Lower Confidence Bound; UCB = Upper Confidence Bound; DEFF = Design Effect; Domain sample size = 6,597 | |||||||||
The analysis of vaccination coverage and zero-dose prevalence across Pathway types, shown in Table 4.69 and Figure 4.18, confirms that the rate of vaccination generally rises as the measure of vulnerability increases. Types labeled R4 and R3.2—designating higher-vulnerability rural types—report the highest prevalence (58% and 42%, respectively), while less-vulnerable urban segments like Under the Age of 1 (U1) and U2 report just 11% and 23%. Separate regression-based Wald tests on the urban and rural domains confirm that these ordinal associations are statistically significant (\(F_{(3, 496)}=20.8\), \(p<.001\) for infants in urban areas, \(F_{(3, 496)}=6.0\), \(p<.001\) for rural areas).
Infants 12-23 months | 15-23 months | |||||||||||||||||||||||||
|---|---|---|---|---|---|---|---|---|---|---|---|---|---|---|---|---|---|---|---|---|---|---|---|---|---|---|
BCG | HepB | OPV | Penta | IPV | Pneumococcal | Rotavirus | MCV1 | YF | Meni. | Fully vaccinated | Zero-dose | Sampled # of children | ||||||||||||||
0 | 1 | 2 | 3 | 1 | 2 | 3 | 1 | 2 | 1 | 2 | 3 | 1 | 2 | 3 | B.A.a | N.I.S.b | Truec | Gavid | MCV2 | |||||||
Urban | ||||||||||||||||||||||||||
Lower vulnerability (U1) | 91.8 | 87.7 | 90.6 | 88.5 | 84.2 | 75.9 | 88.8 | 85.6 | 79.8 | 85.9 | 67.6 | 88.0 | 85.4 | 79.1 | 87.9 | 84.9 | 77.4 | 81.3 | 57.7 | 56.7 | 77.8 | 48.8 | 8.2 | 11.2 | 360 | 72.9 |
Medium-low vulnerability (U2) | 79.4 | 74.4 | 82.9 | 79.7 | 77.2 | 74.3 | 77.2 | 73.7 | 72.3 | 75.4 | 60.3 | 76.7 | 73.2 | 70.5 | 75.6 | 72.0 | 69.8 | 66.9 | 52.5 | 50.3 | 65.6 | 43.2 | 15.8 | 22.8 | 354 | 55.7 |
Medium-high vulnerability (U3) | 79.3 | 74.1 | 78.4 | 76.0 | 72.2 | 67.2 | 75.7 | 74.0 | 71.5 | 74.2 | 62.8 | 75.1 | 73.9 | 70.3 | 75.1 | 73.6 | 70.1 | 70.3 | 51.9 | 50.9 | 68.3 | 46.4 | 20.4 | 24.3 | 1,328 | 64.5 |
Higher vulnerability (U4) | 62.3 | 51.7 | 64.5 | 60.7 | 58.1 | 52.9 | 57.8 | 55.9 | 53.5 | 56.5 | 45.3 | 57.9 | 56.0 | 53.0 | 57.5 | 55.7 | 52.0 | 53.1 | 41.1 | 40.8 | 51.6 | 30.7 | 34.3 | 42.2 | 1,430 | 48.6 |
Rural | ||||||||||||||||||||||||||
Lower vulnerability (R2) | 69.5 | 58.8 | 70.1 | 66.7 | 64.0 | 59.9 | 65.3 | 63.3 | 61.5 | 65.2 | 57.0 | 65.6 | 63.3 | 61.2 | 64.9 | 62.5 | 59.2 | 60.9 | 47.6 | 49.1 | 59.5 | 37.4 | 29.3 | 34.7 | 1,214 | 53.1 |
Medium-low vulnerability (R3.1) | 65.7 | 51.0 | 65.3 | 64.9 | 62.3 | 58.8 | 63.6 | 62.6 | 61.1 | 62.2 | 54.2 | 63.8 | 62.8 | 60.5 | 63.0 | 61.8 | 58.2 | 59.9 | 47.1 | 45.8 | 58.6 | 33.3 | 33.1 | 36.4 | 1,367 | 50.3 |
Medium-high vulnerability (R3.2) | 60.5 | 46.0 | 60.6 | 59.4 | 57.0 | 54.0 | 58.4 | 57.1 | 56.2 | 57.8 | 51.4 | 58.4 | 57.1 | 55.6 | 58.1 | 56.8 | 53.9 | 54.8 | 46.4 | 45.3 | 54.4 | 31.8 | 38.2 | 41.6 | 4,106 | 47.5 |
Higher vulnerability (R4) | 43.5 | 32.2 | 46.1 | 44.2 | 42.0 | 38.2 | 42.5 | 40.9 | 39.6 | 42.7 | 37.3 | 42.5 | 40.9 | 39.5 | 42.3 | 40.7 | 38.8 | 37.8 | 31.7 | 32.1 | 37.7 | 21.9 | 53.5 | 57.5 | 598 | 33.4 |
All | 65.5 | 54.2 | 66.0 | 64.0 | 61.2 | 57.2 | 62.7 | 61.0 | 59.3 | 61.8 | 53.0 | 62.6 | 61.0 | 58.6 | 62.3 | 60.5 | 57.2 | 58.1 | 46.3 | 45.6 | 57.0 | 34.7 | 32.8 | 37.3 | 10,895 | 51.5 |
Note: Children are considered to have received the vaccine if it was either written on the child’s vaccination card or reported by the caregiver. For children whose vaccination information is based on the caregiver's report, date of vaccination is not collected. The proportions of vaccinations given during the first and second years of life are assumed to be the same as for children with a written record of vaccination. Unreliable proportions have been suppressed and replaced with asterisks. For more detailed statistical output, please see the appendices. | ||||||||||||||||||||||||||
aBasic antigens: BCG, three doses of pentavalent (DPT-HepB-Hib), a complete series of either IPV or OPV (excluding polio vaccine given at birth) or a combination of at least one each of IPV and OPV, and one dose of measles vaccine. | ||||||||||||||||||||||||||
bNigeria immunization schedule: BCG, HepB (birth dose), three doses of DPT-HepB-Hib (pentavalent), four doses of OPV, two doses of IPV, three doses of pneumococcal vaccine, three doses of rotavirus, one dose of measles vaccine, one dose of yellow fever vaccine, and one dose of meningitis vaccine. The second measles dose is excluded as children become eligible to receive it at 15 months. | ||||||||||||||||||||||||||
cTrue zero-dose children lacking evidence of any vaccine. Cases where the cargiver initially reports the child as having received vaccines (Q409) but is subsequently unable to recall which antigens were administered are recorded as zero-dose children. | ||||||||||||||||||||||||||
dGavi operationalizes zero-dose children as those who have not received a DPT-containing vaccine. | ||||||||||||||||||||||||||
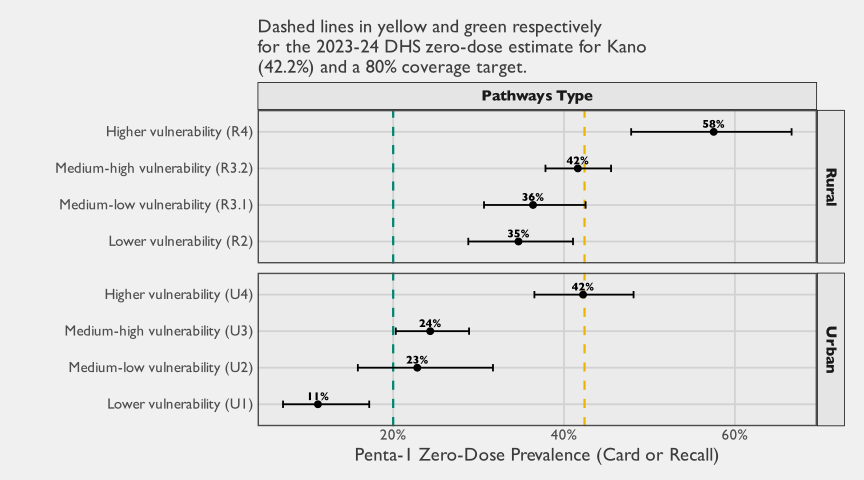
4.2.4 Dropouts
RI_CONT_01
Infants who only received the first dose in a series and were age-eligible to receive the subsequent dose before the survey can be considered to have “dropped out” of the immunization program.
As shown in the vaccination coverage and timeliness charts in Section 4.2.5, dropout between two crude doses is fairly common among children aged 12–23 months in Kano State. This is especially evident in Figure 4.22, where coverage bars for later doses in a series (e.g., DPT-3) are consistently shorter than those for earlier doses (e.g., DPT-1).
Figure 4.19, Figure 4.20 and Figure 4.21 illustrate dropout patterns among children aged 12–23 months for vaccines typically administered during the first year of life. Notably, Nassarawa LGA consistently shows higher dropout rates across all VCQI continuity indicators.
Dropout from DPT-1 to DPT-3 is generally low across the board, with an overall rate of 5.4% when combining sentinel and non-sentinel LGAs (Figure 4.19). This suggests that an estimated 94.6% of children who start the DPT series eventually complete it. Gabasawa and Gaya LGAs stand out with slightly lower dropout rates of 3.4% and 2.6%, respectively, compared to Nassarawa and the non-sentinel LGAs combined.
The transition from DPT-3 to MCV-1 follows a similar pattern, where the overall dropout rate is 3.4% (Figure 4.20). Again, Nassarawa exceeds this with a dropout rate of 4.7%.
The highest recorded dropout rates appear in the transition between OPV-1 to OPV-3 series (Figure 4.21). The combined dropout rate for this series is 10.6%, with Gaya standing out as a lower outlier (6.1%), and Nassarawa recording the highest proportion at 15.9%.
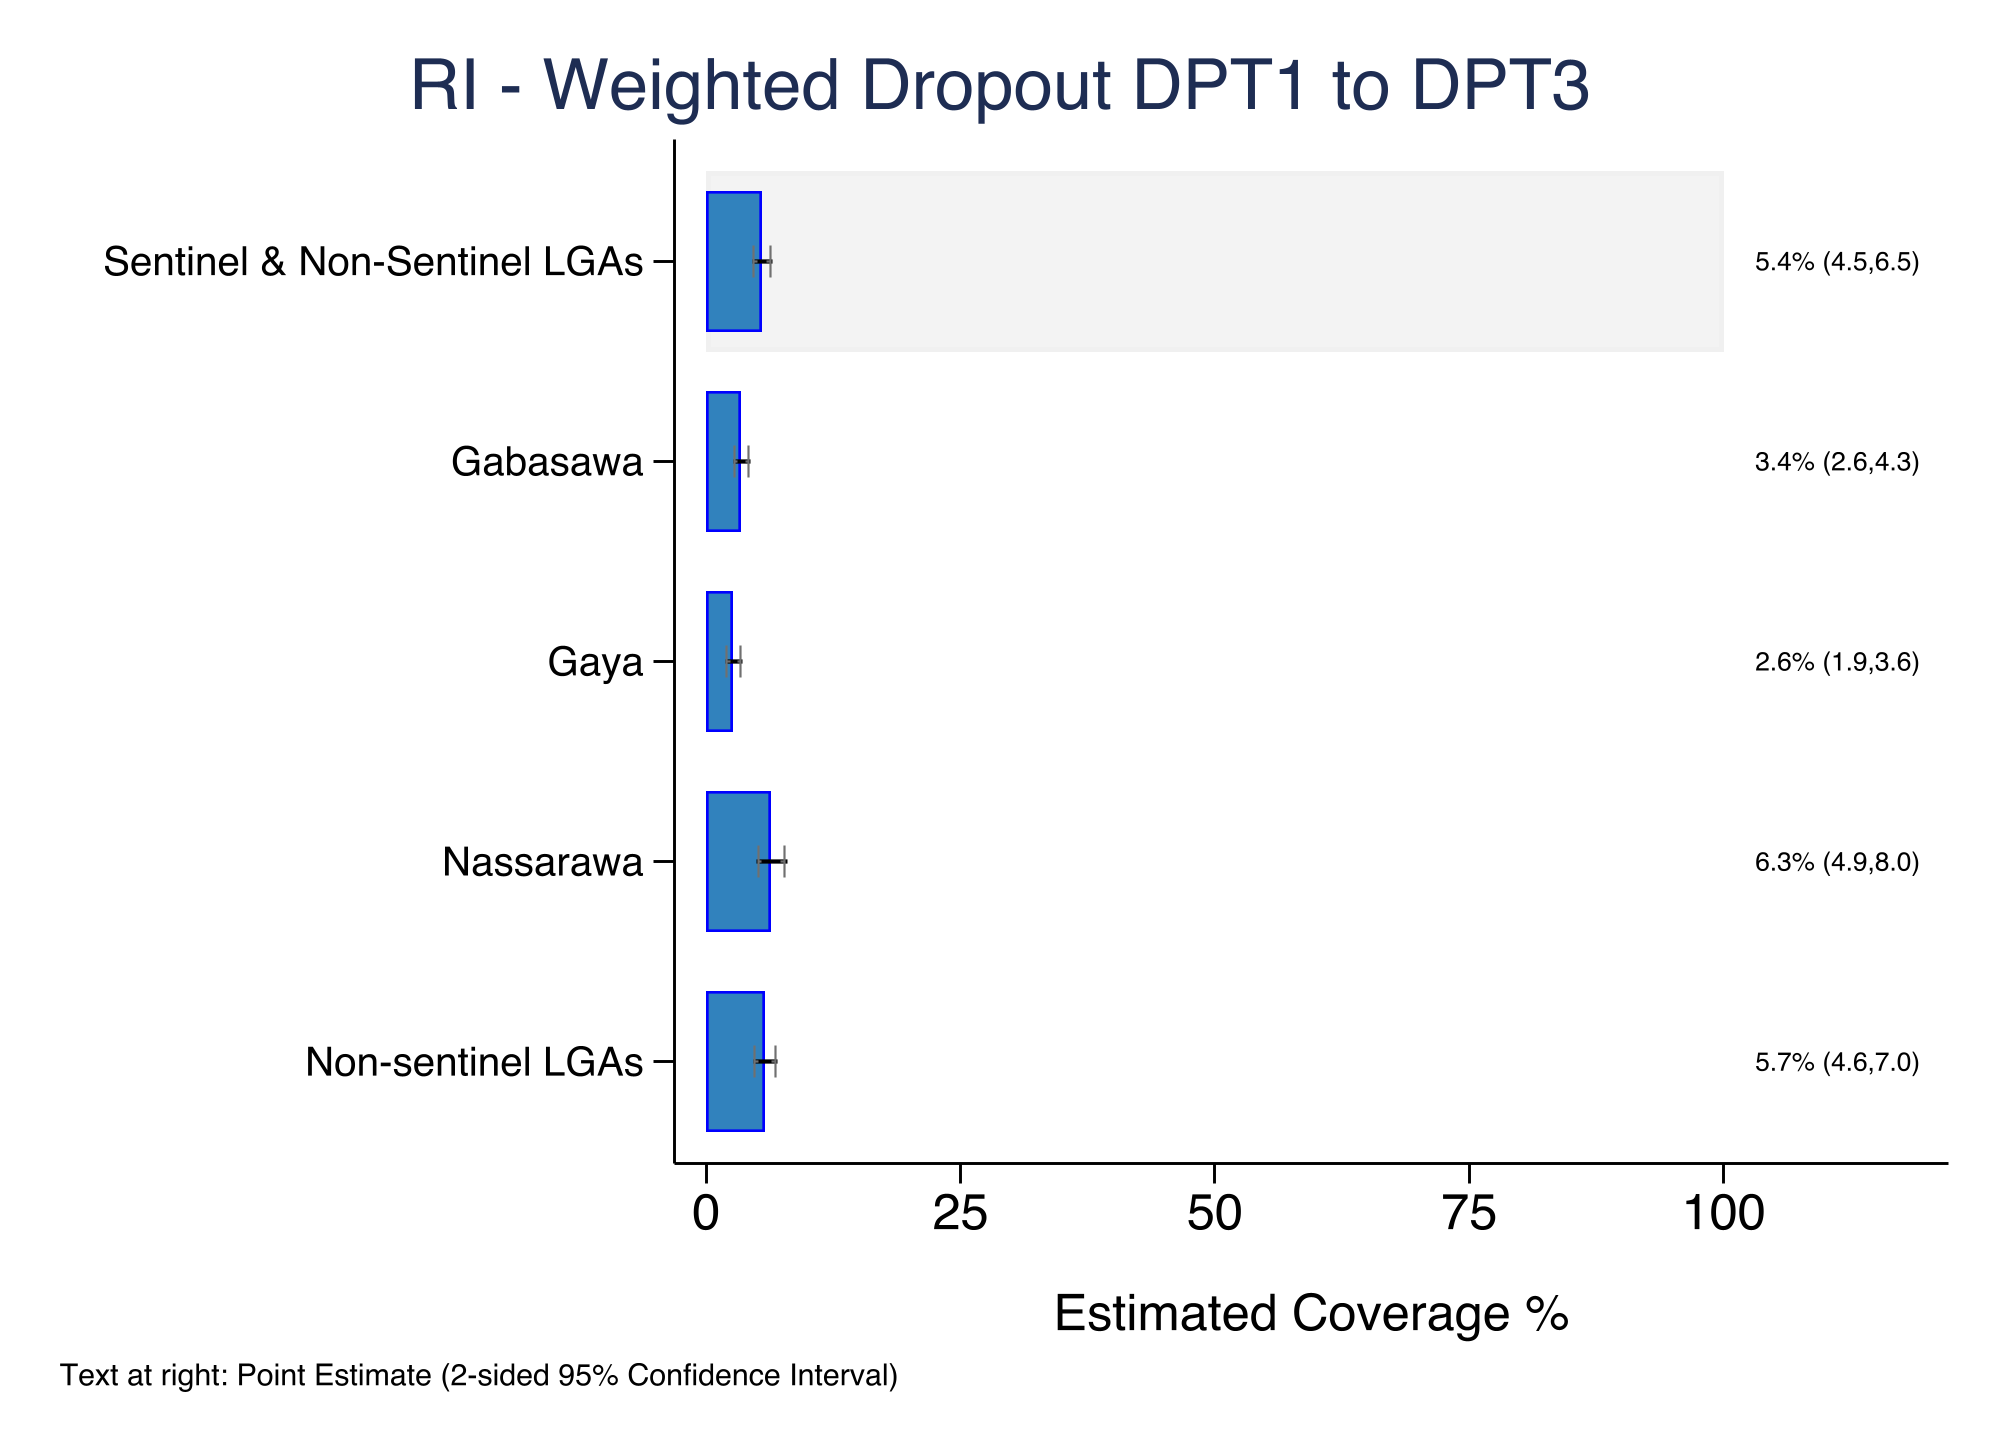
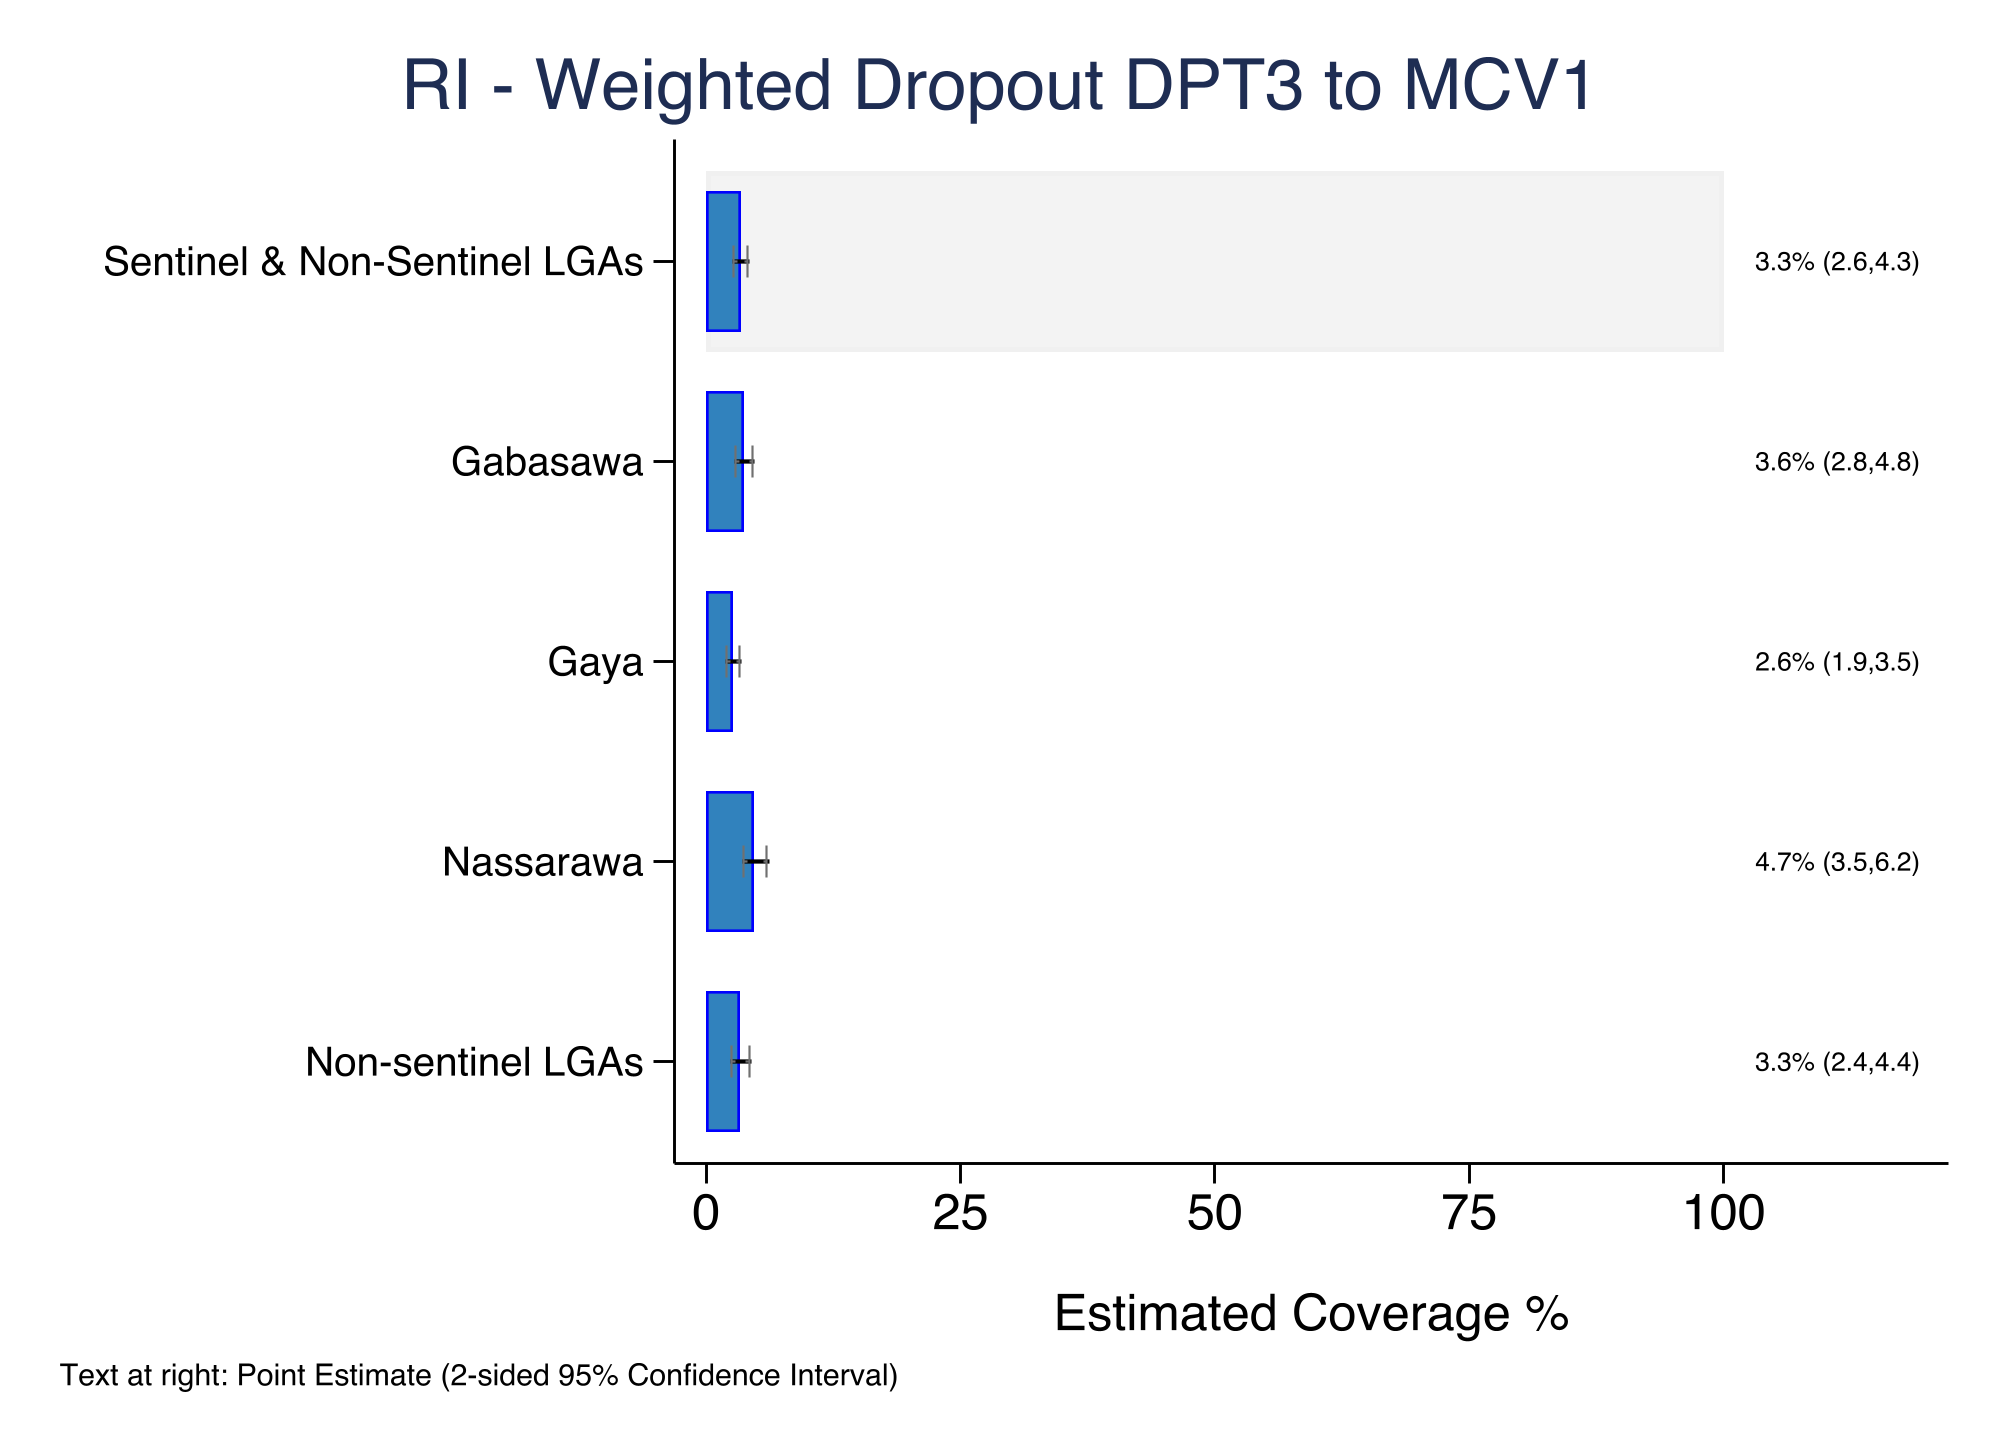
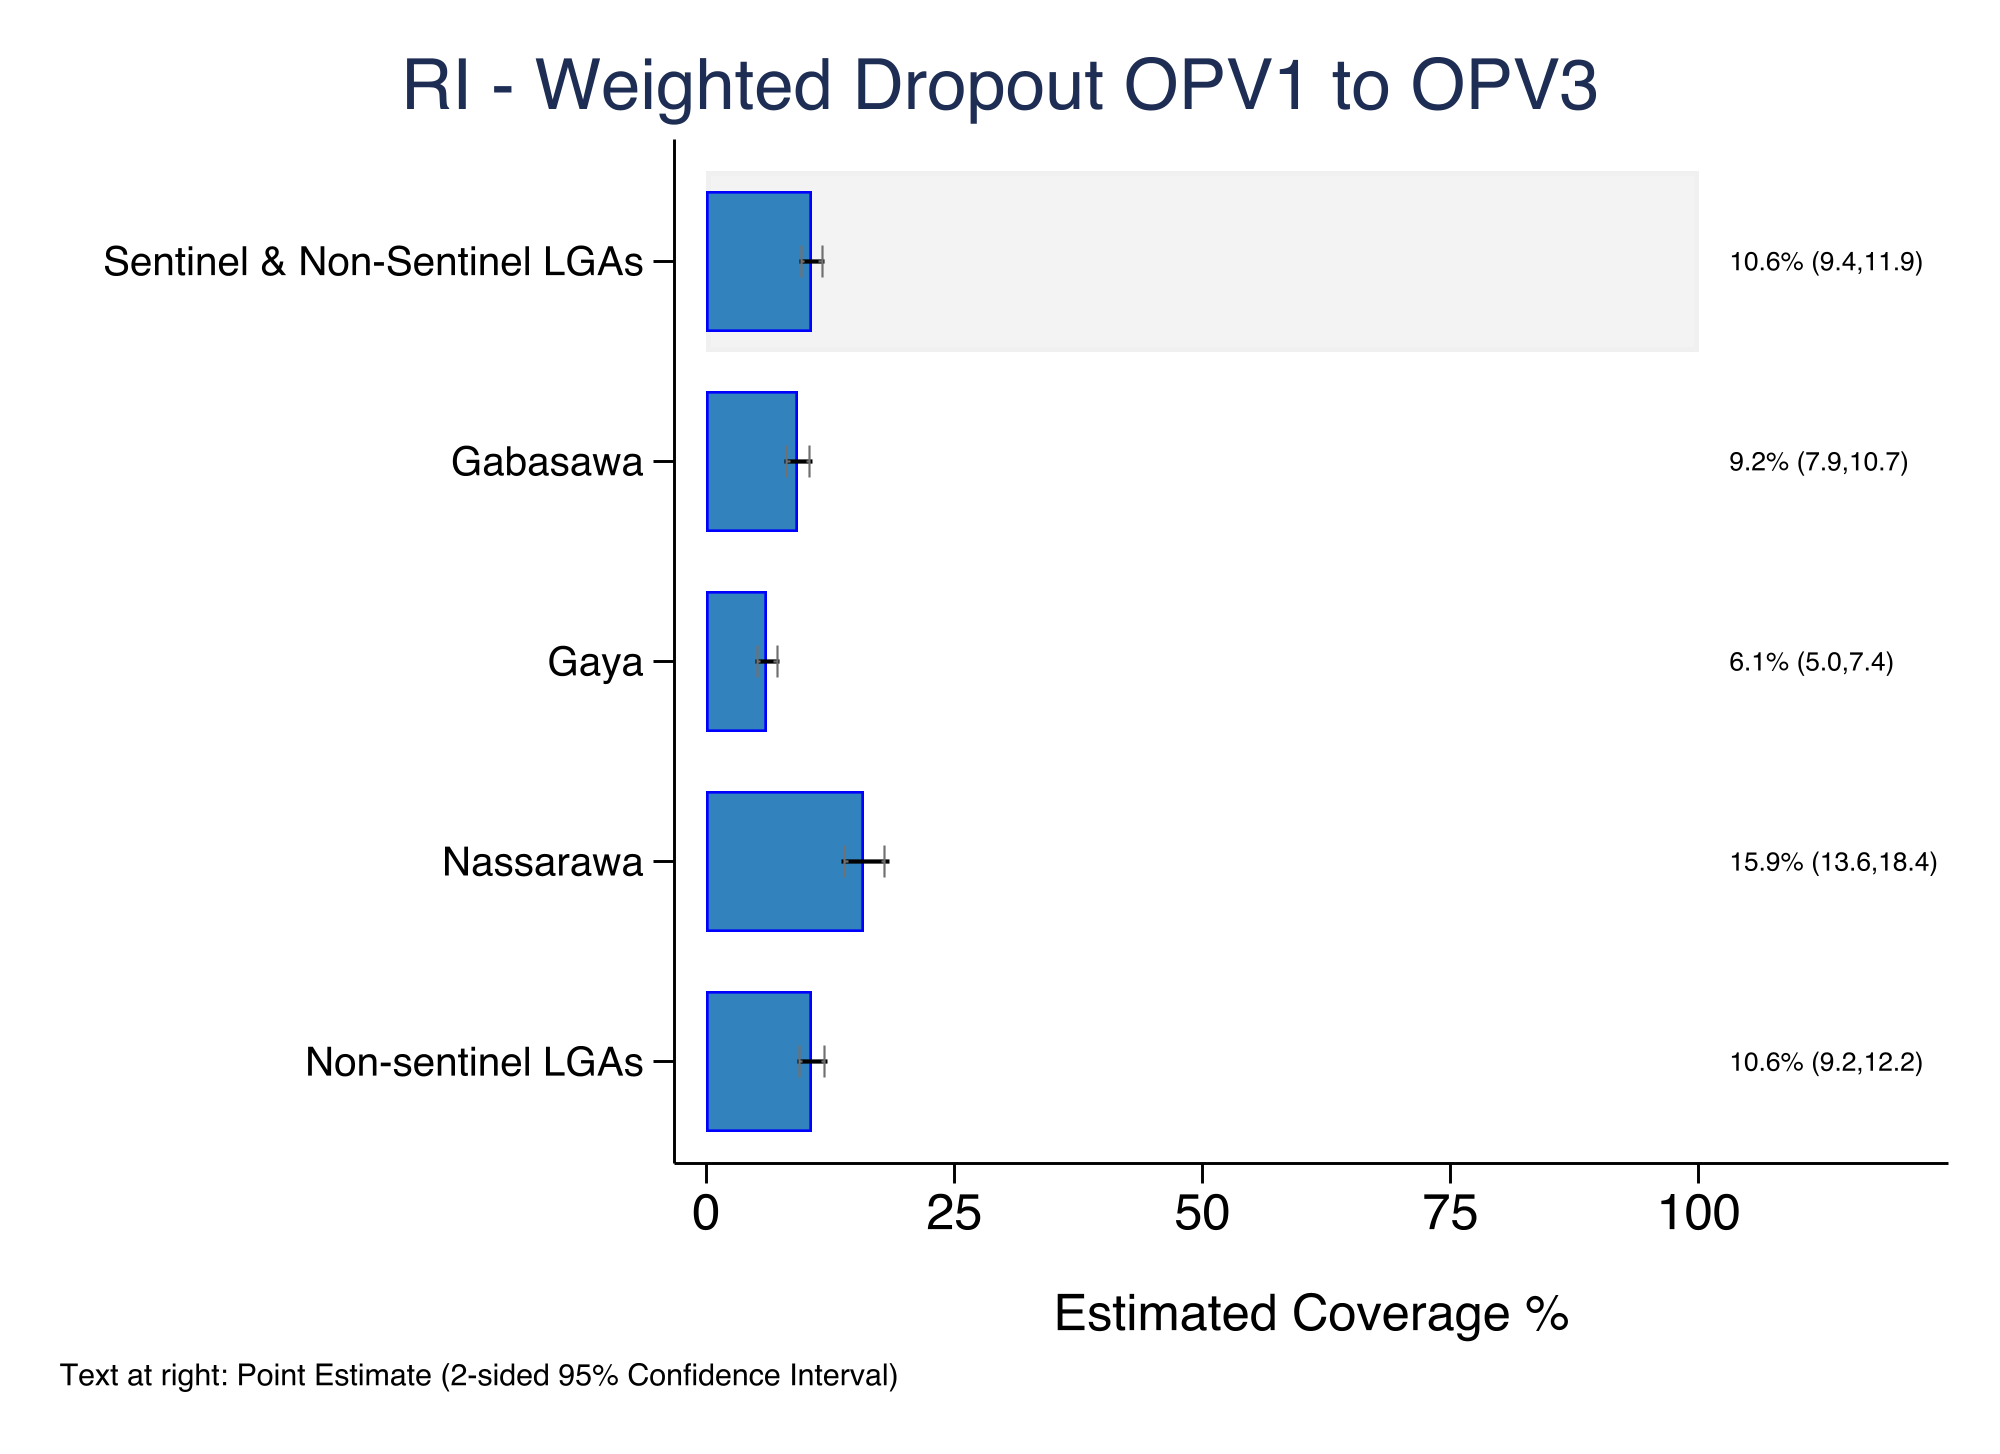
4.2.5 Vaccination Timeliness and Simultaneity
4.2.5.1 Vaccination Coverage and Timeliness
Figure 4.22 presents the estimated proportion of children with evidence of receiving each dose in the national immunization schedule, by timeliness and across all survey areas (see Appendix C for the analysis of non-sentinel LGAs and sentinel LGAs individually). The proportions combine evidence from HBR and caregiver recall.
Just over half of the vaccination evidence in this survey comes from HBRs, which provide dates needed to assess timeliness. Overall, cards were seen for only 54.7% of children aged 12–23 months. Children for which timelines cannot be determined fall into the “Timing Unknown” group (grey bars), either because the evidence comes from caregiver recall or, in some cases, an illegible or implausible date on the card.
The color-saturated part of each bar, to the left of the vertical HBR line, shows what we know about timeliness based on the child’s date of birth and recorded vaccination dates.
Coverage of birth doses, doses scheduled up to 14 weeks, and MCV-1 is fairly consistent, at around 60–65%. HepB (birth dose) and IPV-2 are exceptions, with lower coverage OPV0 and BCG exceed 65% coverage, with BCG showing the highest rate of timely vaccination.
Early vaccination (dark purple bars) is rare across all dose types and occurs at similar levels for non-birth doses.
Dropout is visible in every dose series, as the bars for later doses tend to be shorter than those for earlier doses. For OPV, for instance, 64.0% of children received the first dose, but 57.2% received OPV-3. In other words, about 11% of age-eligible children who started the series had not completed it (on a weighted basis). For DPT, weighted dropout rates hover around 5%.12
Timeliness also declines across doses. For each dose in a series, the green bars—doses given within recommended 28-day window—are longest for the first dose and shorter for later doses. Timely vaccination is highest for early doses such as BCG, OPV0, and HepB, but drops for later doses (with the exception of OPV-1) and for vaccines given later in infancy.
Many children received later doses late—under two months (light pink bars) or more than two months overdue (dark pink bars)—especially for DPT-3, PCV-3, and RV-3. The dark pink bars, representing doses given 2+ months late, are smallest for first doses and grow noticeably for later doses.13
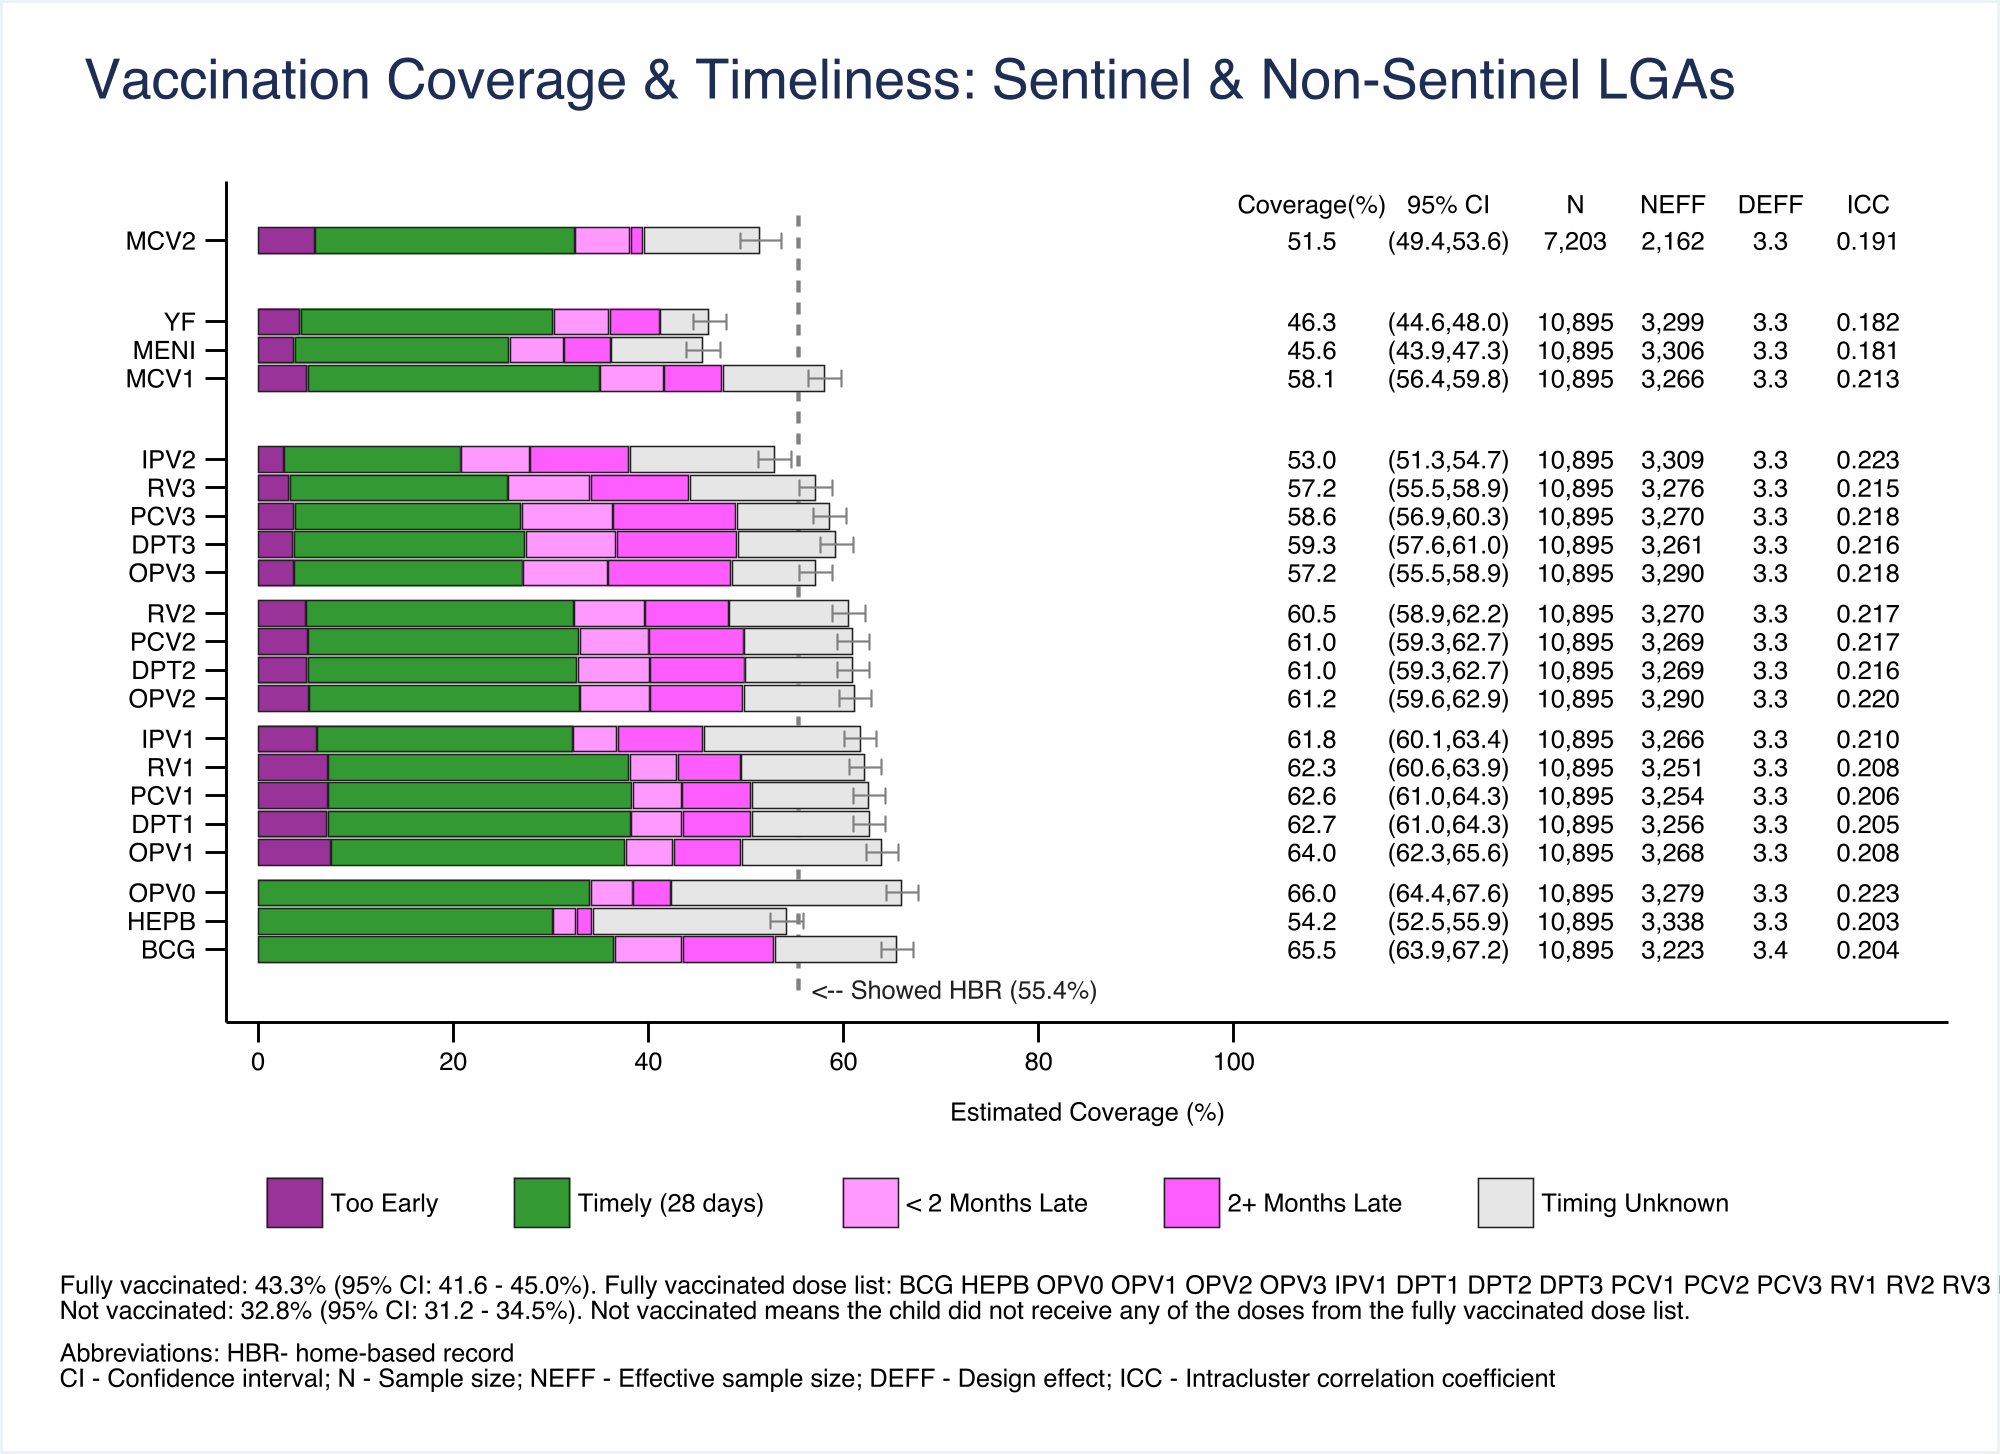
Dose | Too early | Early or timely | No more | Total coverage | Total coverage |
|---|---|---|---|---|---|
BCG | 0.0% | 36.5% | 43.5% | 52.9% | 65.5% |
HEPB | 0.0% | 30.2% | 32.6% | 34.3% | 54.2% |
OPV0 | 0.0% | 34.1% | 38.4% | 42.3% | 66.0% |
OPV1 | 7.5% | 37.6% | 42.6% | 49.5% | 64.0% |
DPT1 | 7.1% | 38.2% | 43.5% | 50.6% | 62.7% |
PCV1 | 7.1% | 38.3% | 43.4% | 50.6% | 62.6% |
RV1 | 7.2% | 38.1% | 43.0% | 49.5% | 62.3% |
IPV1 | 6.0% | 32.3% | 36.8% | 45.7% | 61.8% |
OPV2 | 5.2% | 33.0% | 40.1% | 49.7% | 61.2% |
DPT2 | 5.1% | 32.7% | 40.2% | 49.9% | 61.0% |
PCV2 | 5.1% | 32.9% | 40.0% | 49.8% | 61.0% |
RV2 | 4.9% | 32.4% | 39.6% | 48.3% | 60.5% |
OPV3 | 3.7% | 27.1% | 35.9% | 48.5% | 57.2% |
DPT3 | 3.6% | 27.4% | 36.7% | 49.1% | 59.3% |
PCV3 | 3.7% | 27.0% | 36.4% | 49.0% | 58.6% |
RV3 | 3.2% | 25.6% | 34.1% | 44.2% | 57.2% |
IPV2 | 2.7% | 20.8% | 27.9% | 38.1% | 53.0% |
MCV1 | 5.1% | 35.0% | 41.6% | 47.6% | 58.1% |
MENI | 3.7% | 25.8% | 31.3% | 36.2% | 45.6% |
YF | 4.3% | 30.3% | 36.0% | 41.2% | 46.3% |
MCV2 | 5.8% | 32.5% | 38.1% | 39.5% | 51.5% |
4.2.5.2 Cumulative Coverage Curves
RI_CCC_02
The cumulative coverage curves show the survey-weighted proportion of children whose vaccination card records DPT-1, DPT-2, or DPT-3 at each day of life.
Coverage increases almost vertically on the scheduled ages of 42, 70, and 98 days, when the child becomes eligible for each particular dose. After each of these inflection points, the curves continue to rise at a lower gradient; theses segments represents doses given after the minimum age. Using a 28-day window to define timeliness, a DPT dose is classified as late if it has not been received by the start of the next scheduled dose.
Timeliness is low. For instance, at 70 days—the last available day for a timely DPT-1 vaccination and minimum age for receiving DPT-2—less than 40% of children have a documented first dose. Similarly, ~35% of children have DPT-3 recorded by 98 days. Overall, as doses increase—from DPT-1 to DPT-2 and from DPT-2 to DPT-3—the proportion of children that are late also increases.
The curves eventually reach a plateau, which indicates the final documented coverage achieved in the sample. Even after allowing for late doses, these plateaus remain substantially below 100%, confirming incomplete overall coverage.
There is minimal evidence of early DPT vaccination, as the curves remain close to 0% before the scheduled ages.
Trends are similar across survey areas.
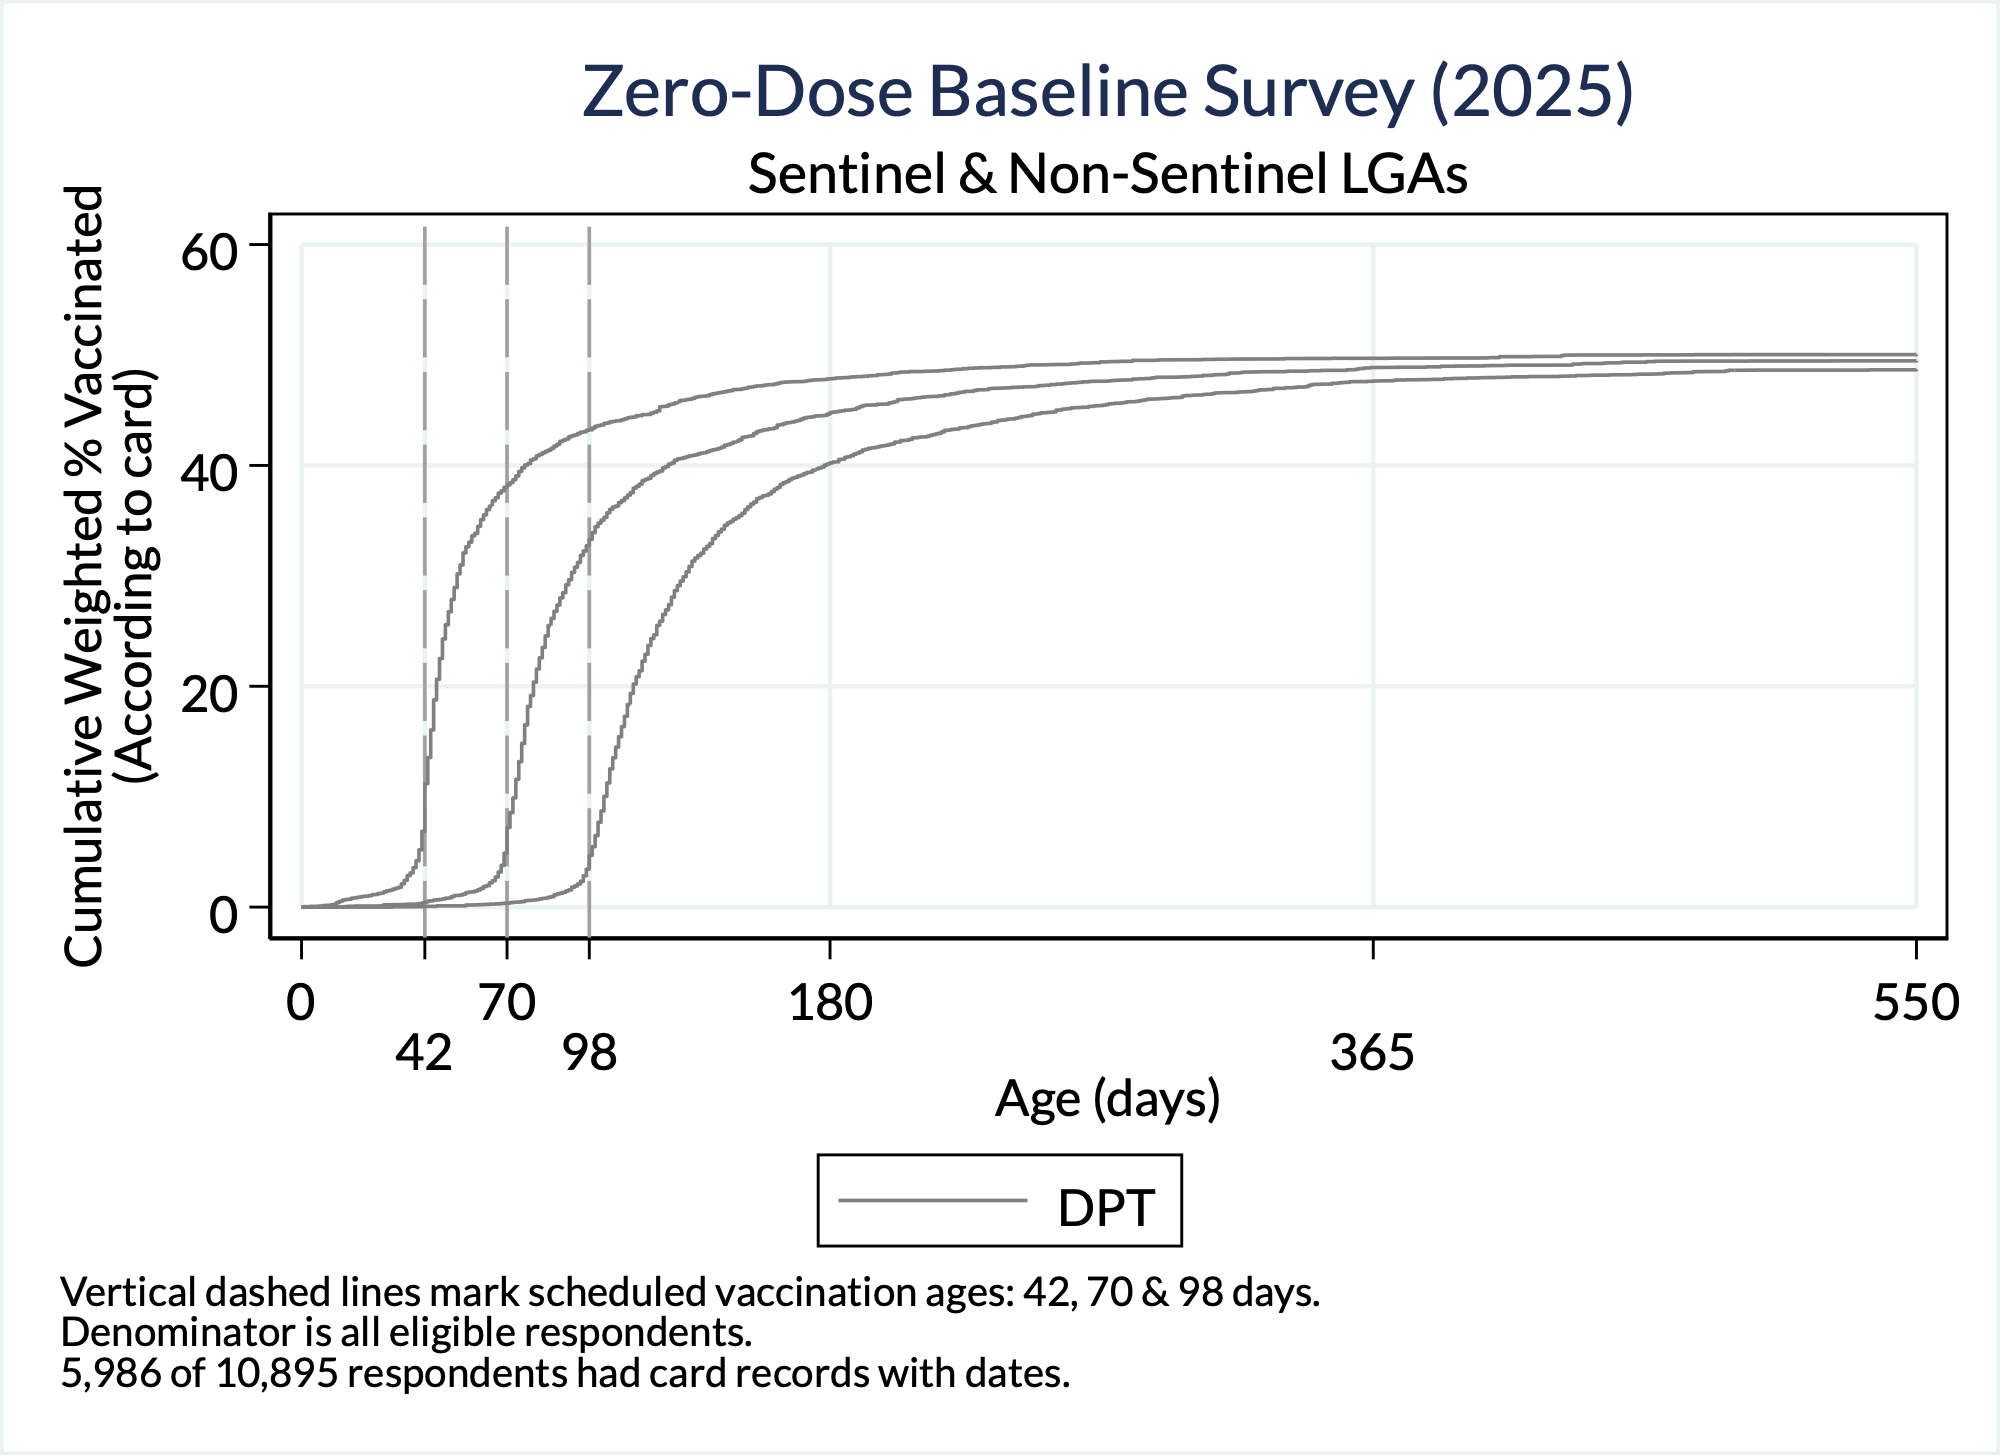
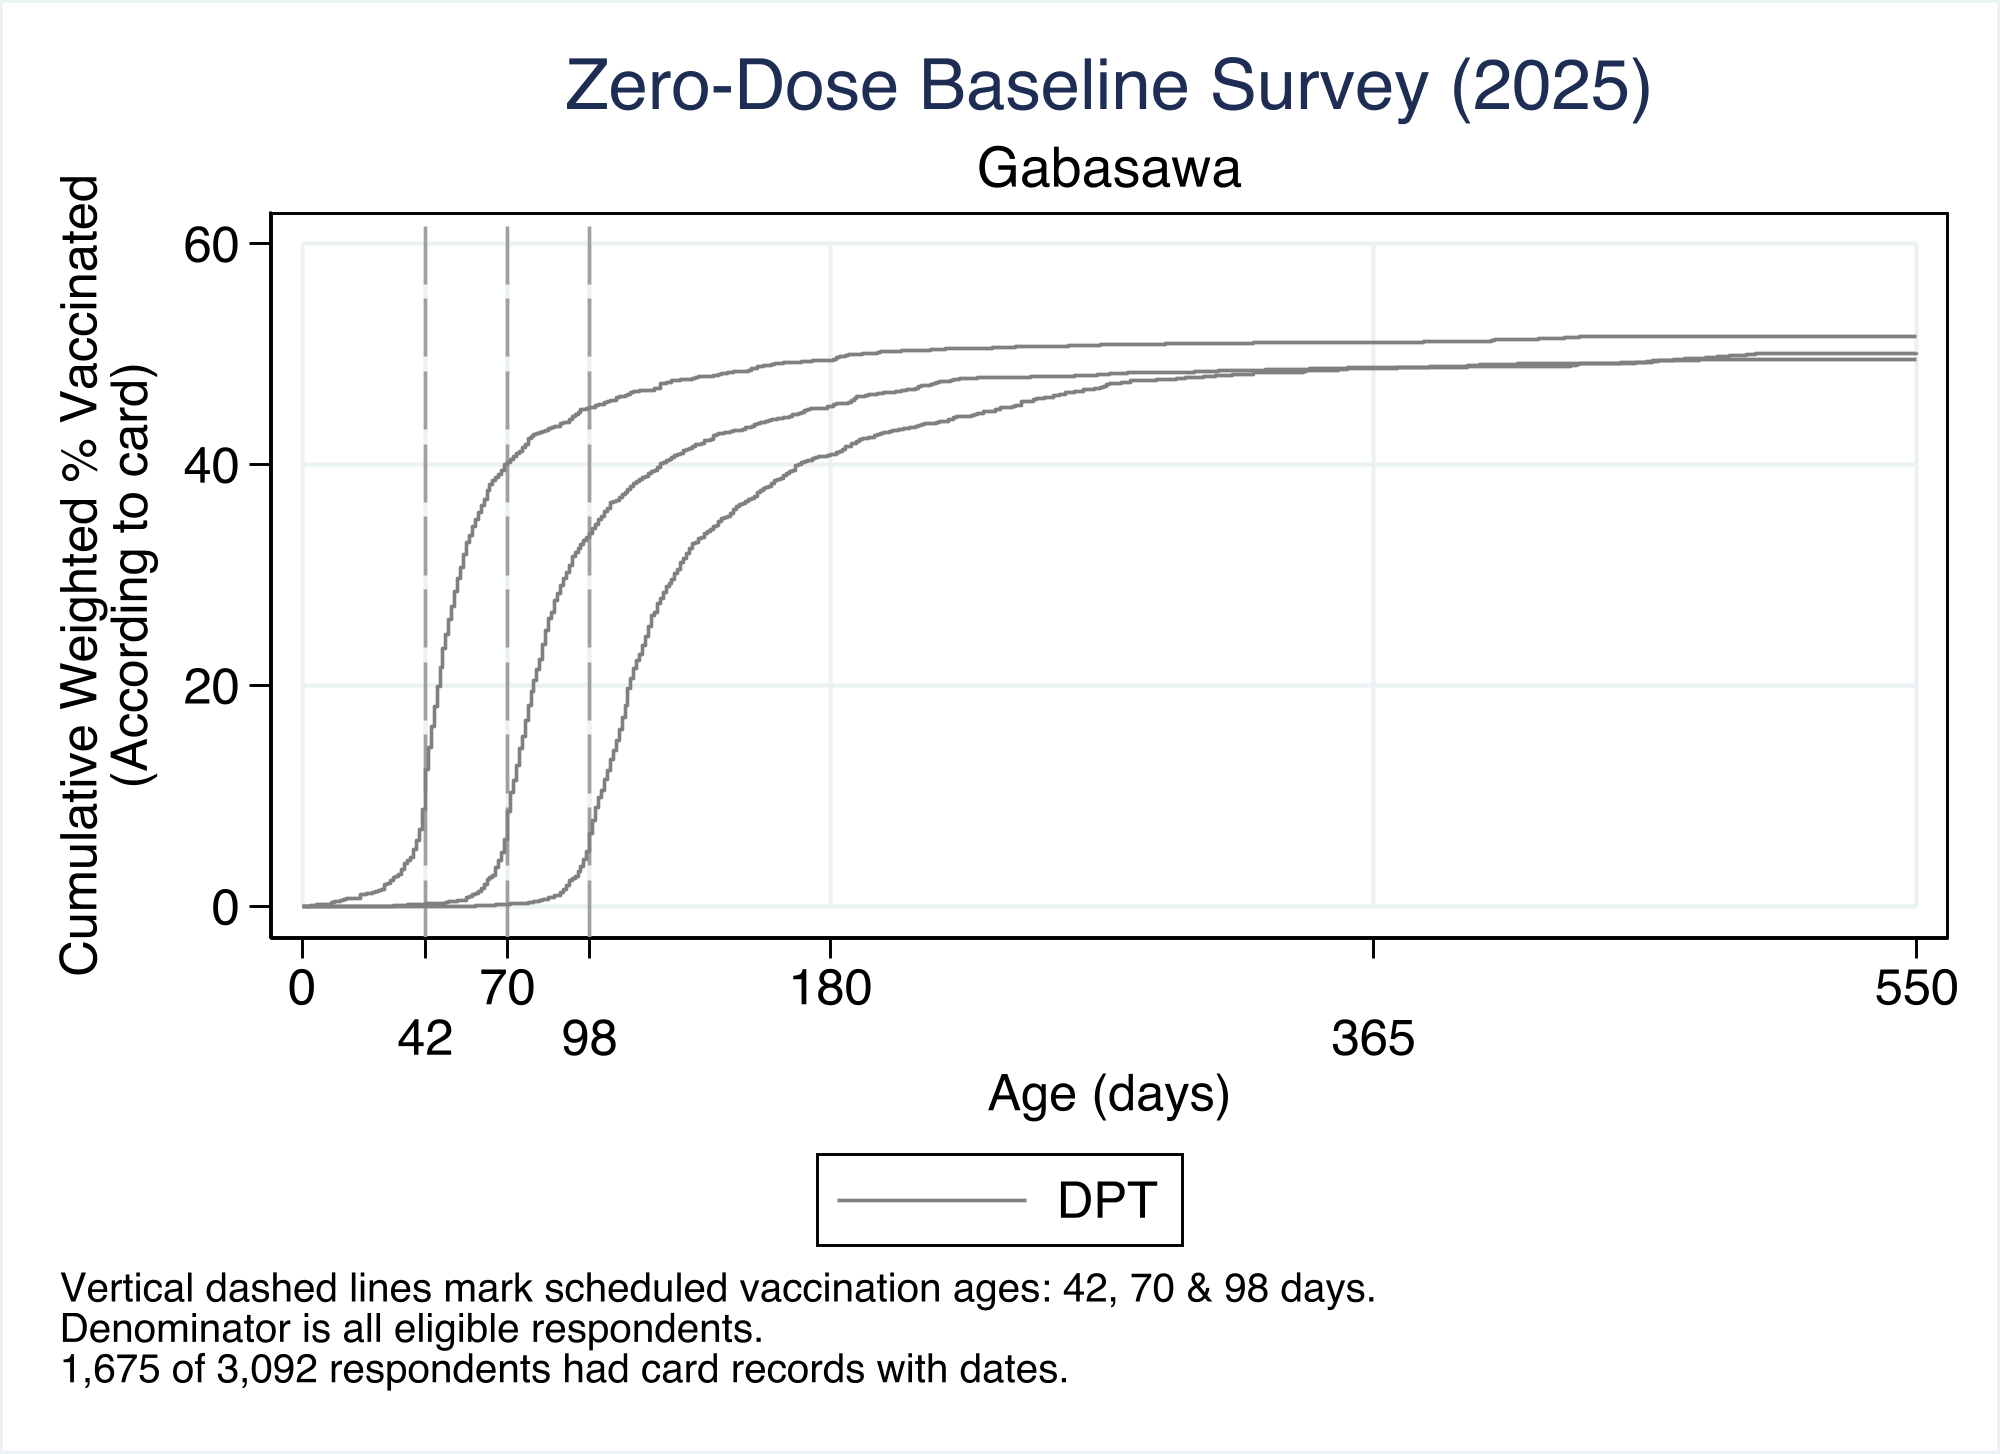
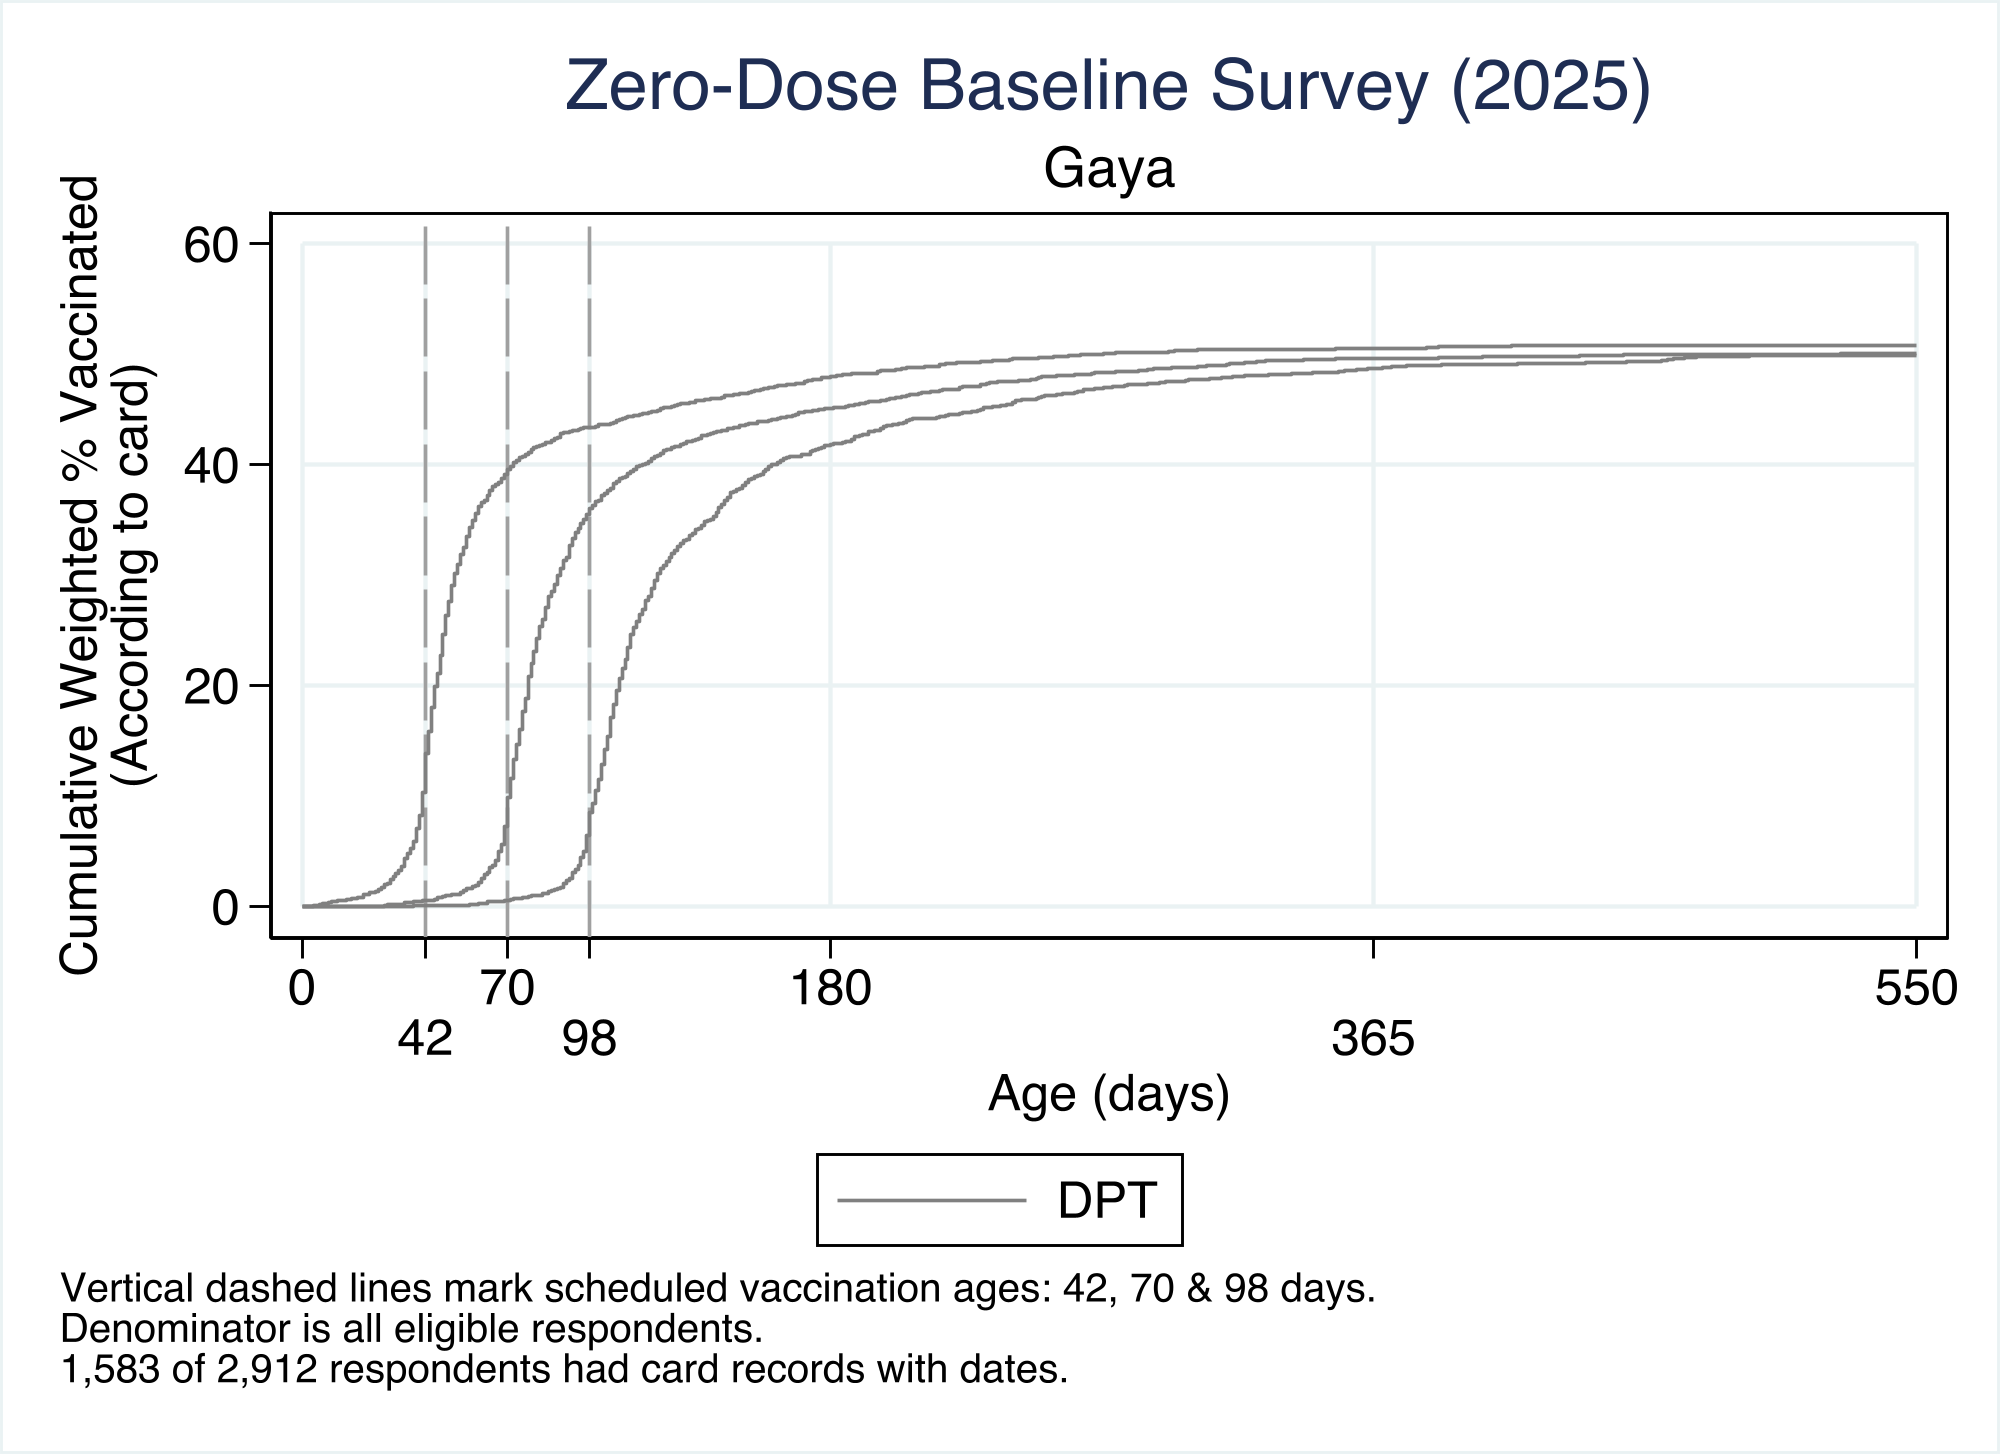
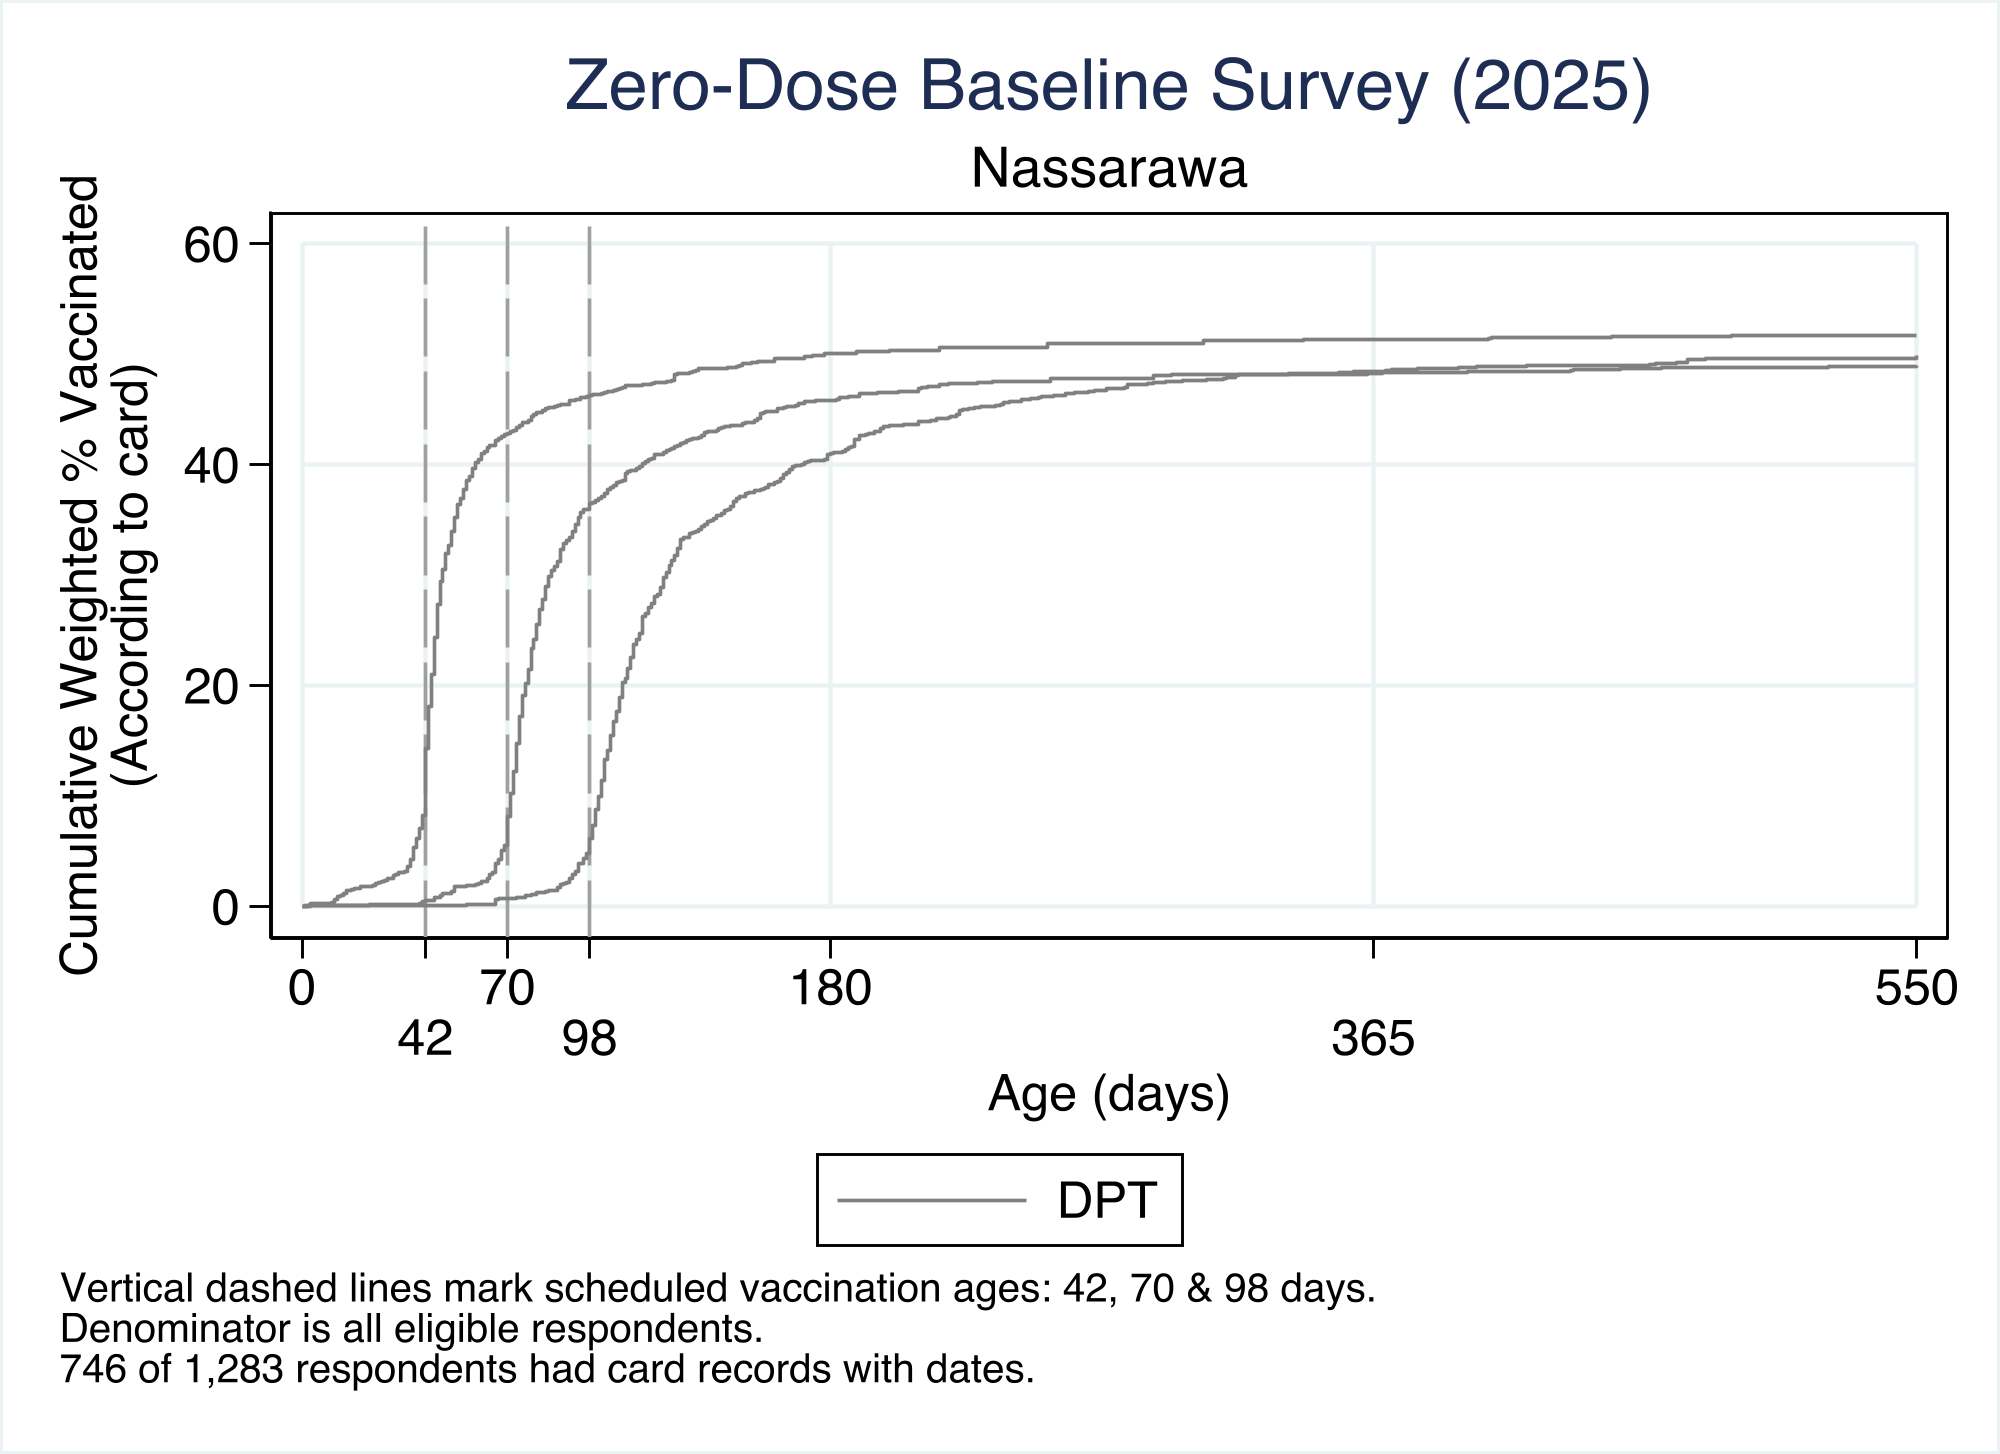
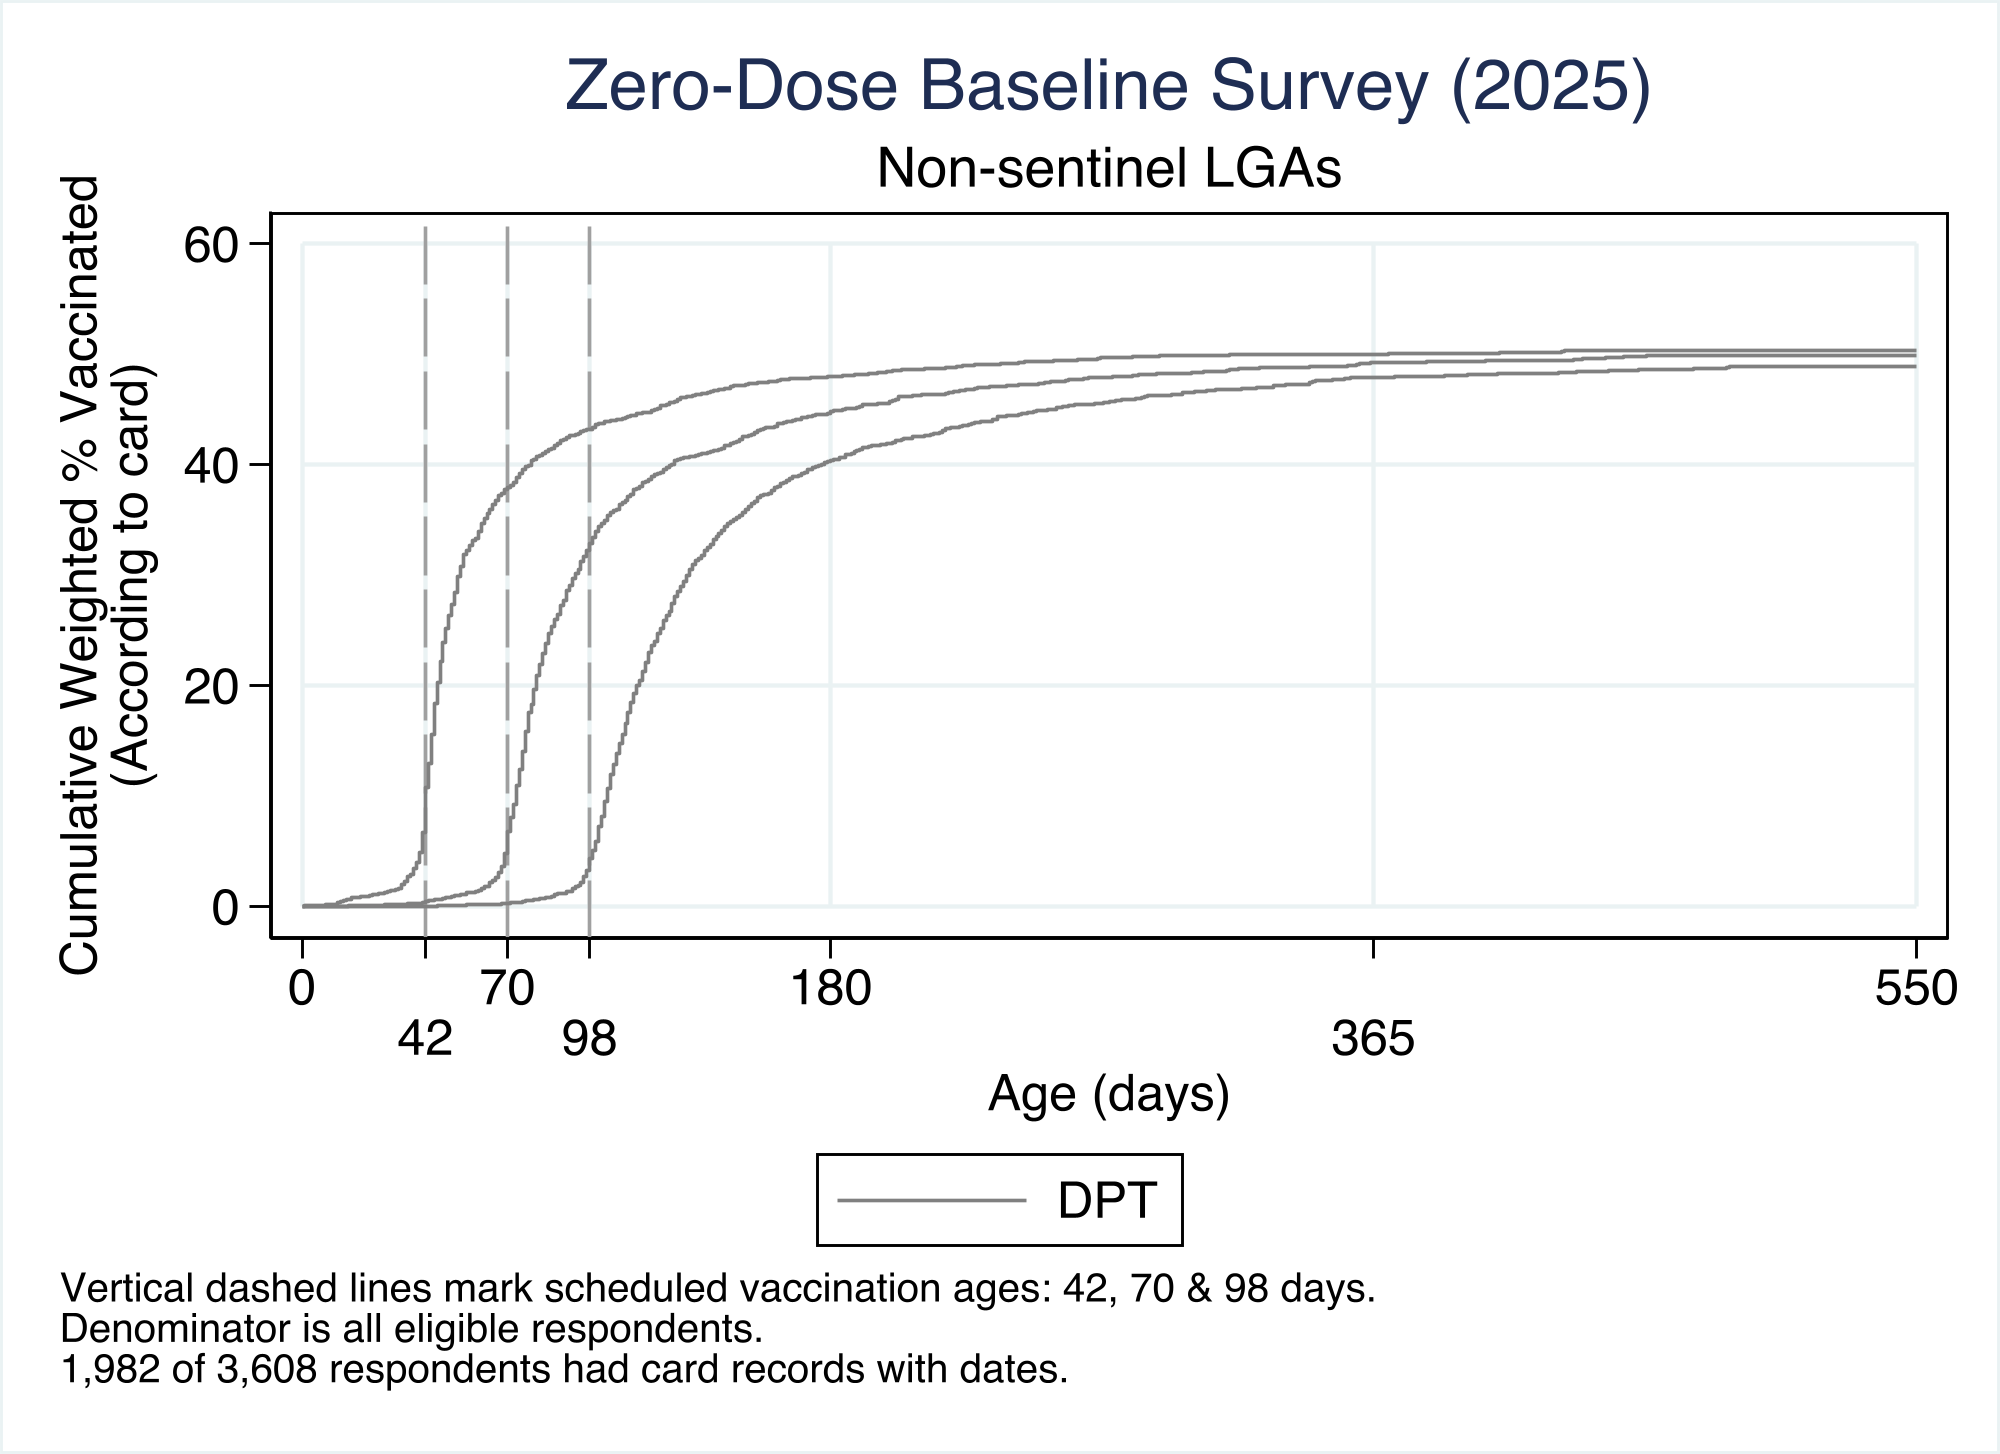
4.2.5.3 Cumulative Interval Curves
RI_CIC_02
Similar insights can be derived from cumulative interval curves for DPT-1 and DPT-2. These curves show the survey-weighted proportion of all age-eligible children whose vaccination cards show an intra-dose interval no longer than 28 days.
Nearly the entire curve lies flat until the scheduled 28-day interval, confirming that almost no children receive the second dose prematurely.
At the 28-day mark, the line jumps abruptly to about one quarter of the cohort, reflecting on-schedule administration.
Beyond this point, the curve rises only gradually, adding roughly eighteen percentage points over the next month and then reaching a plateau near 42%.
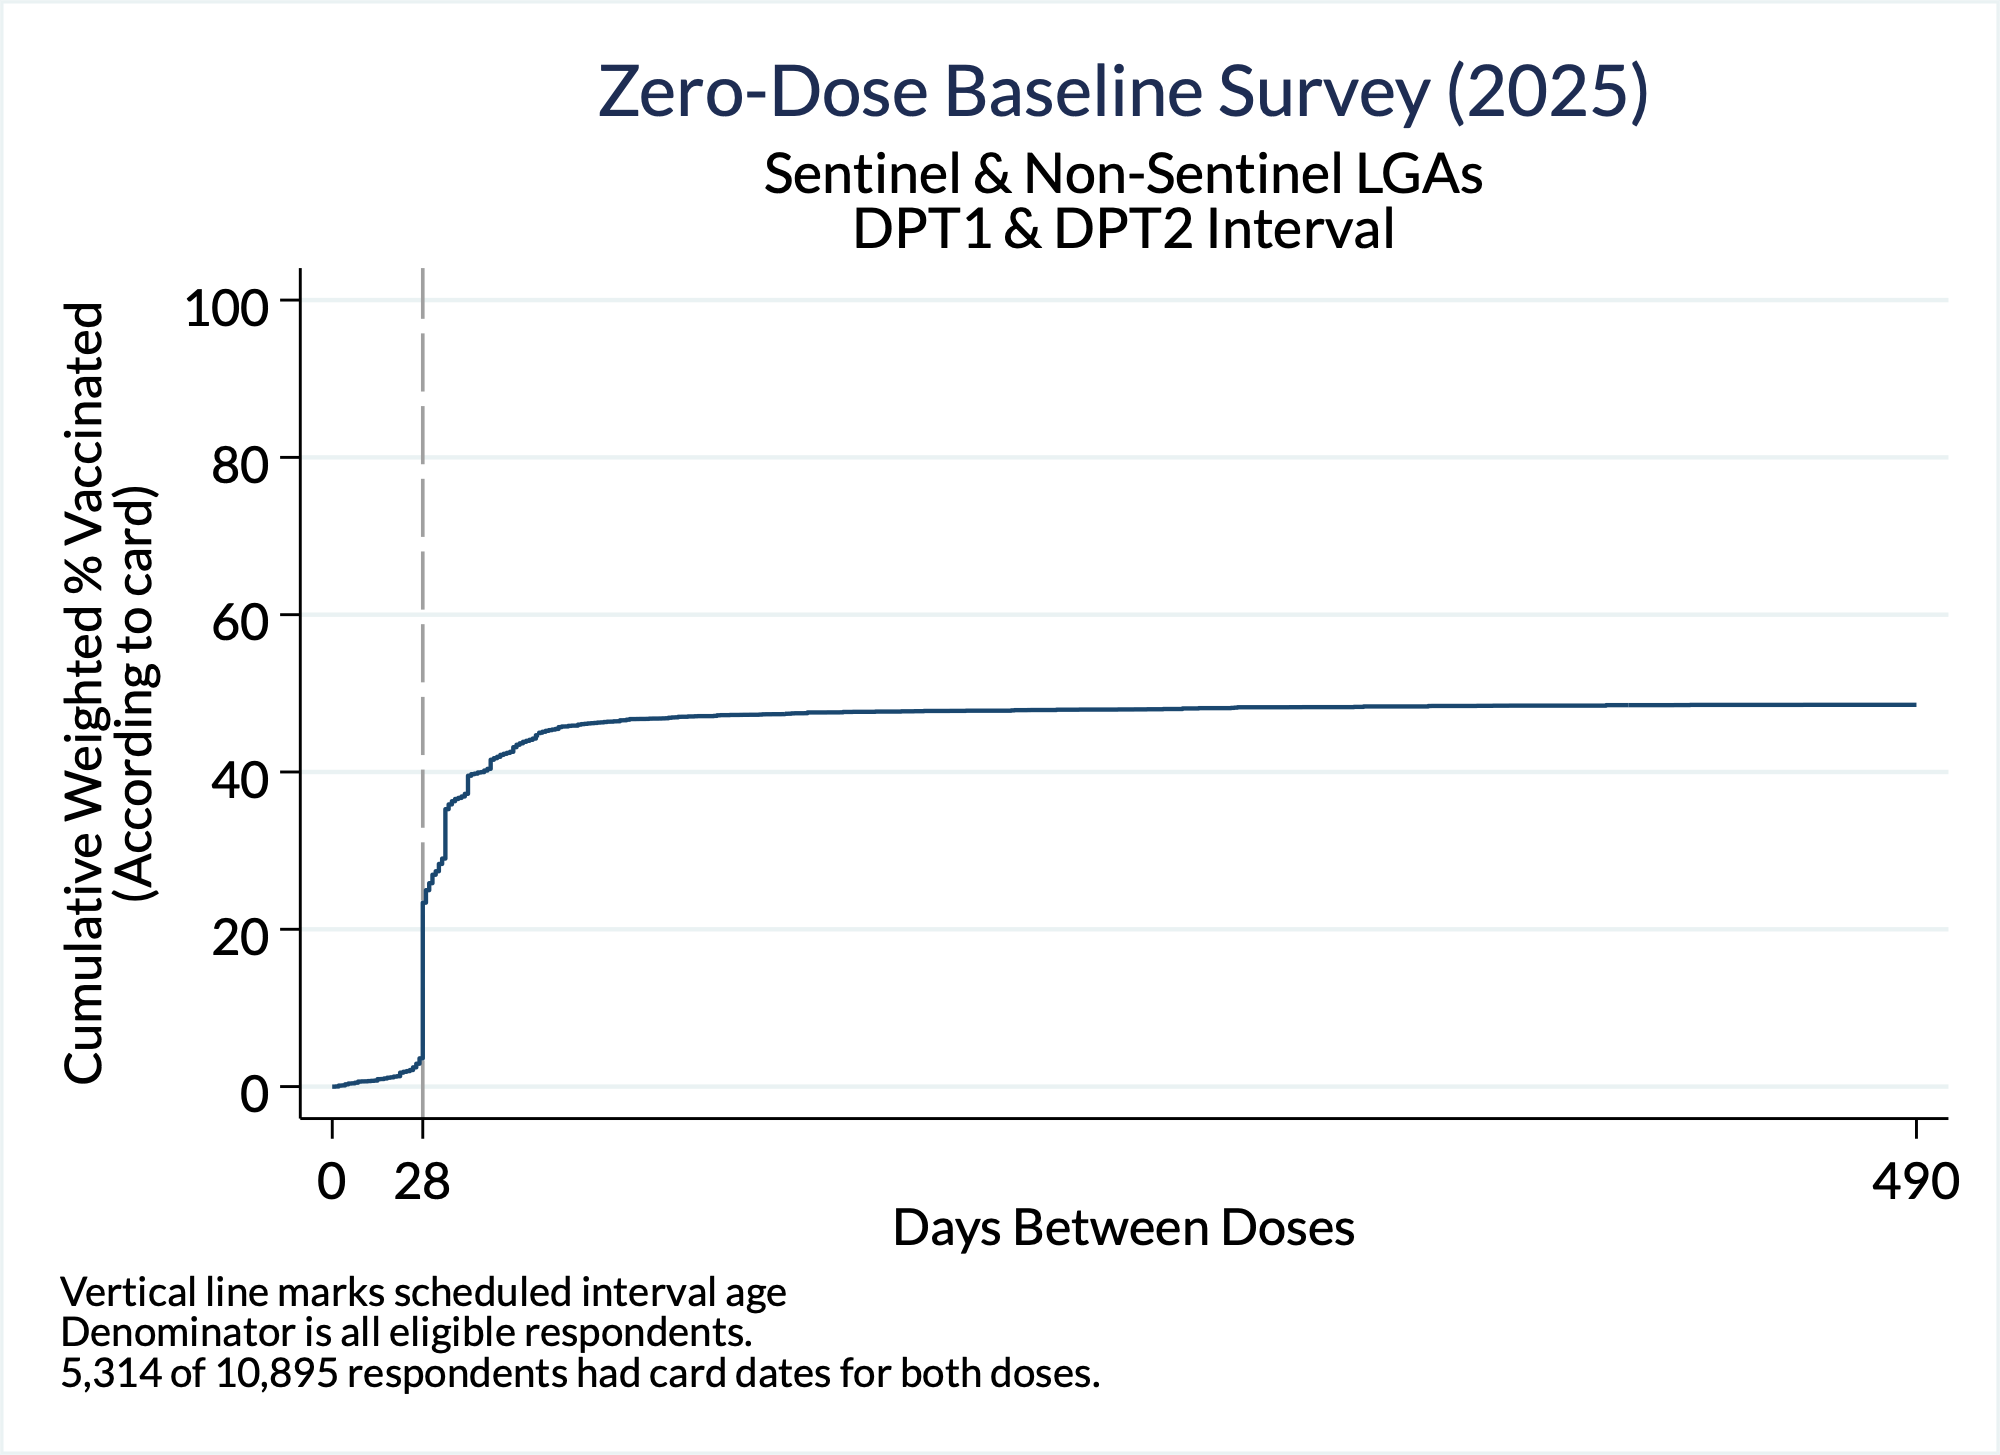
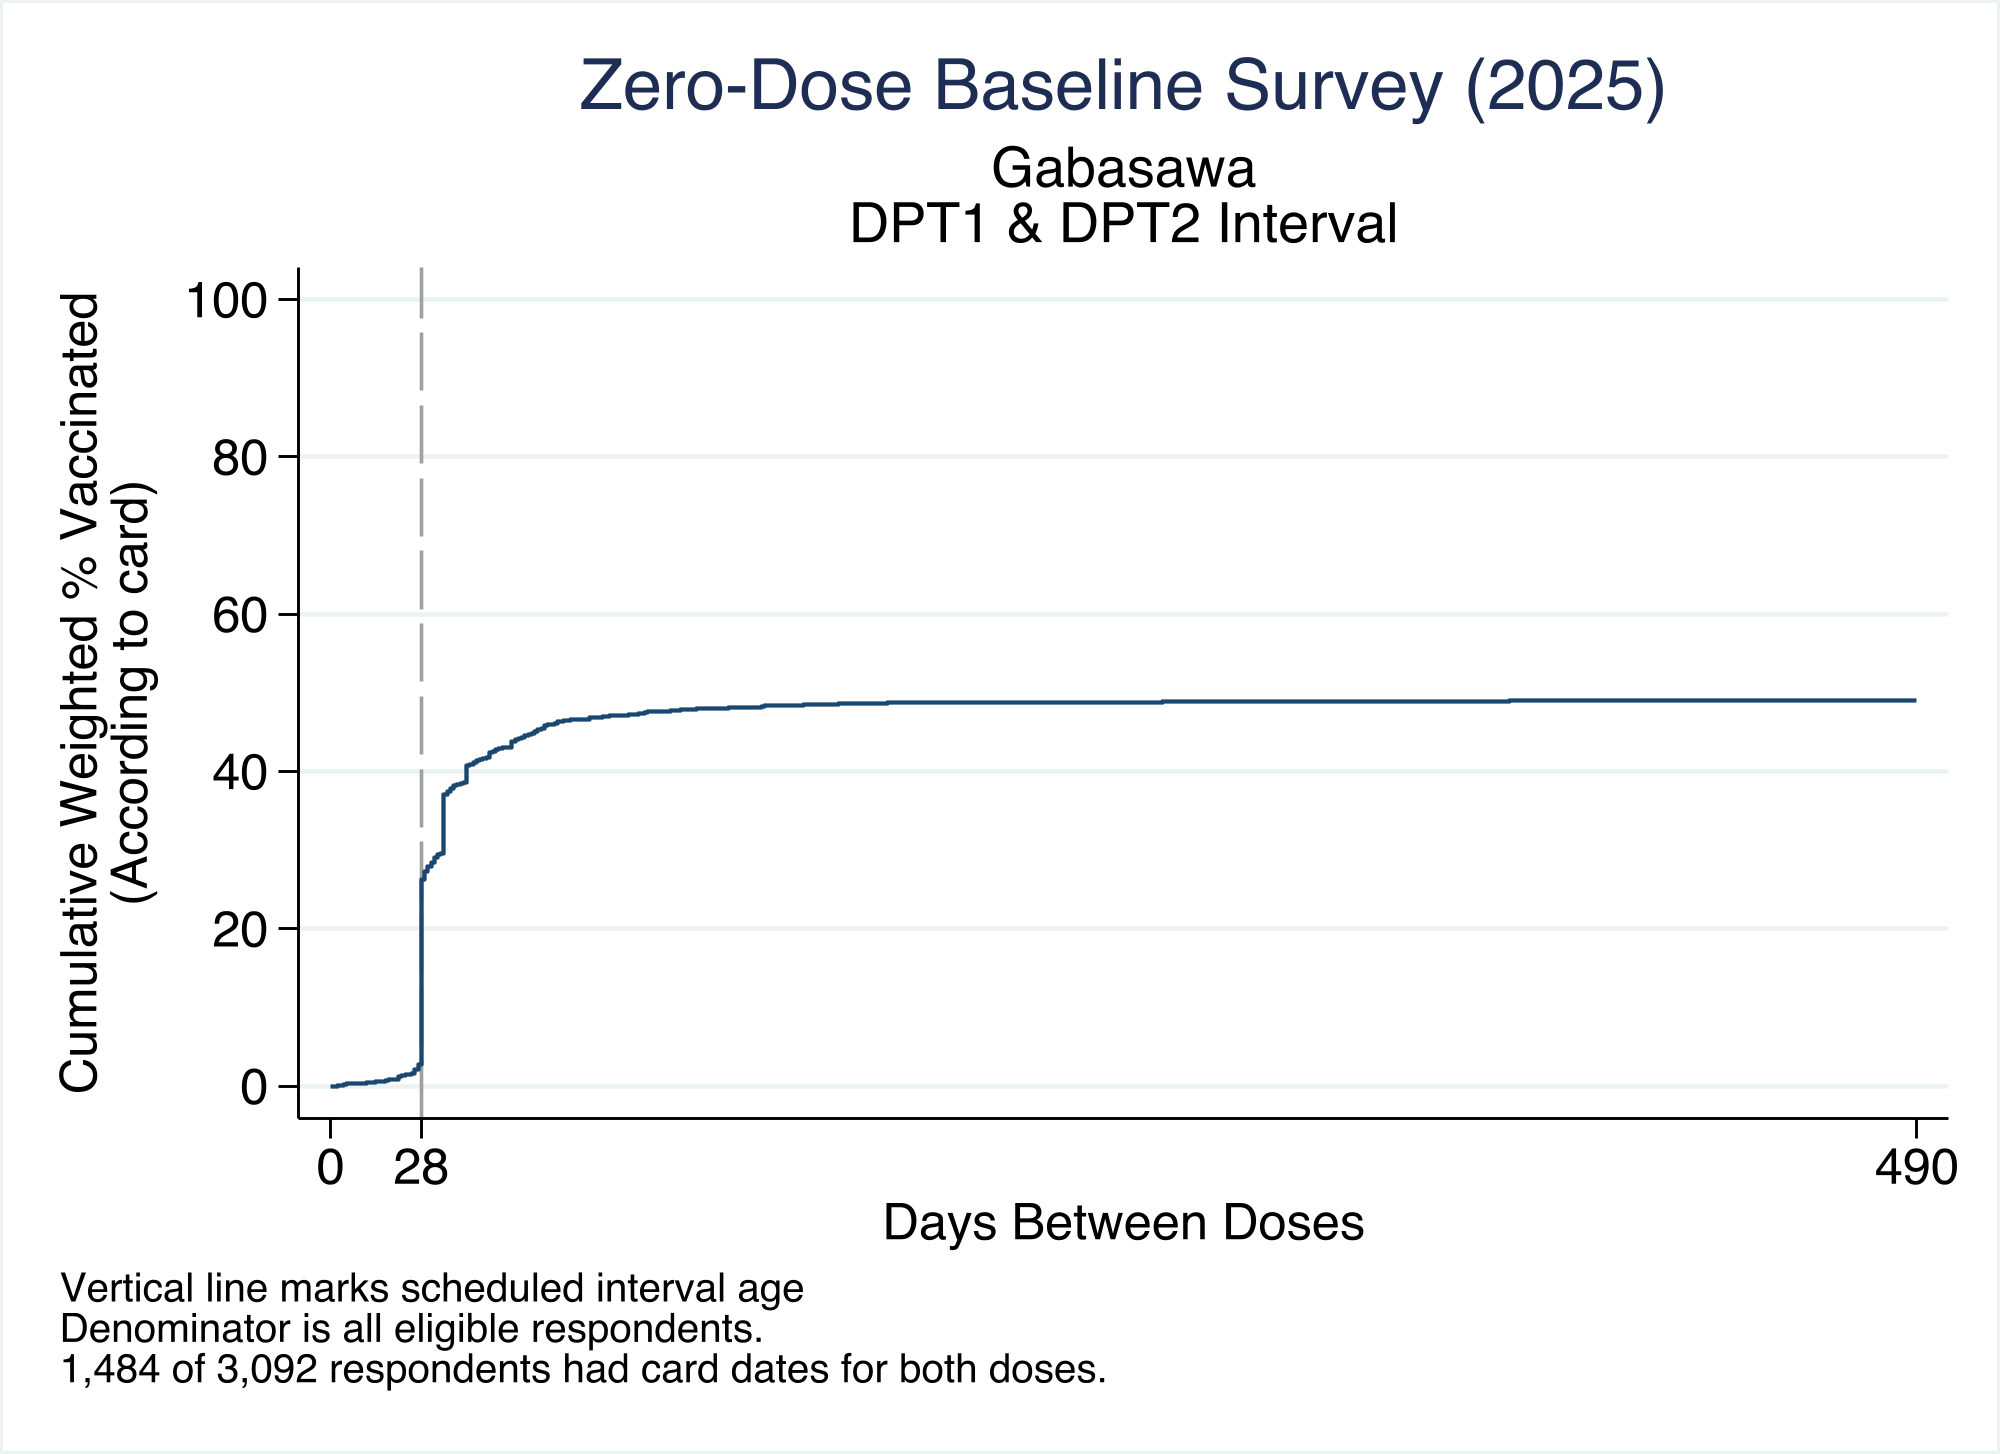
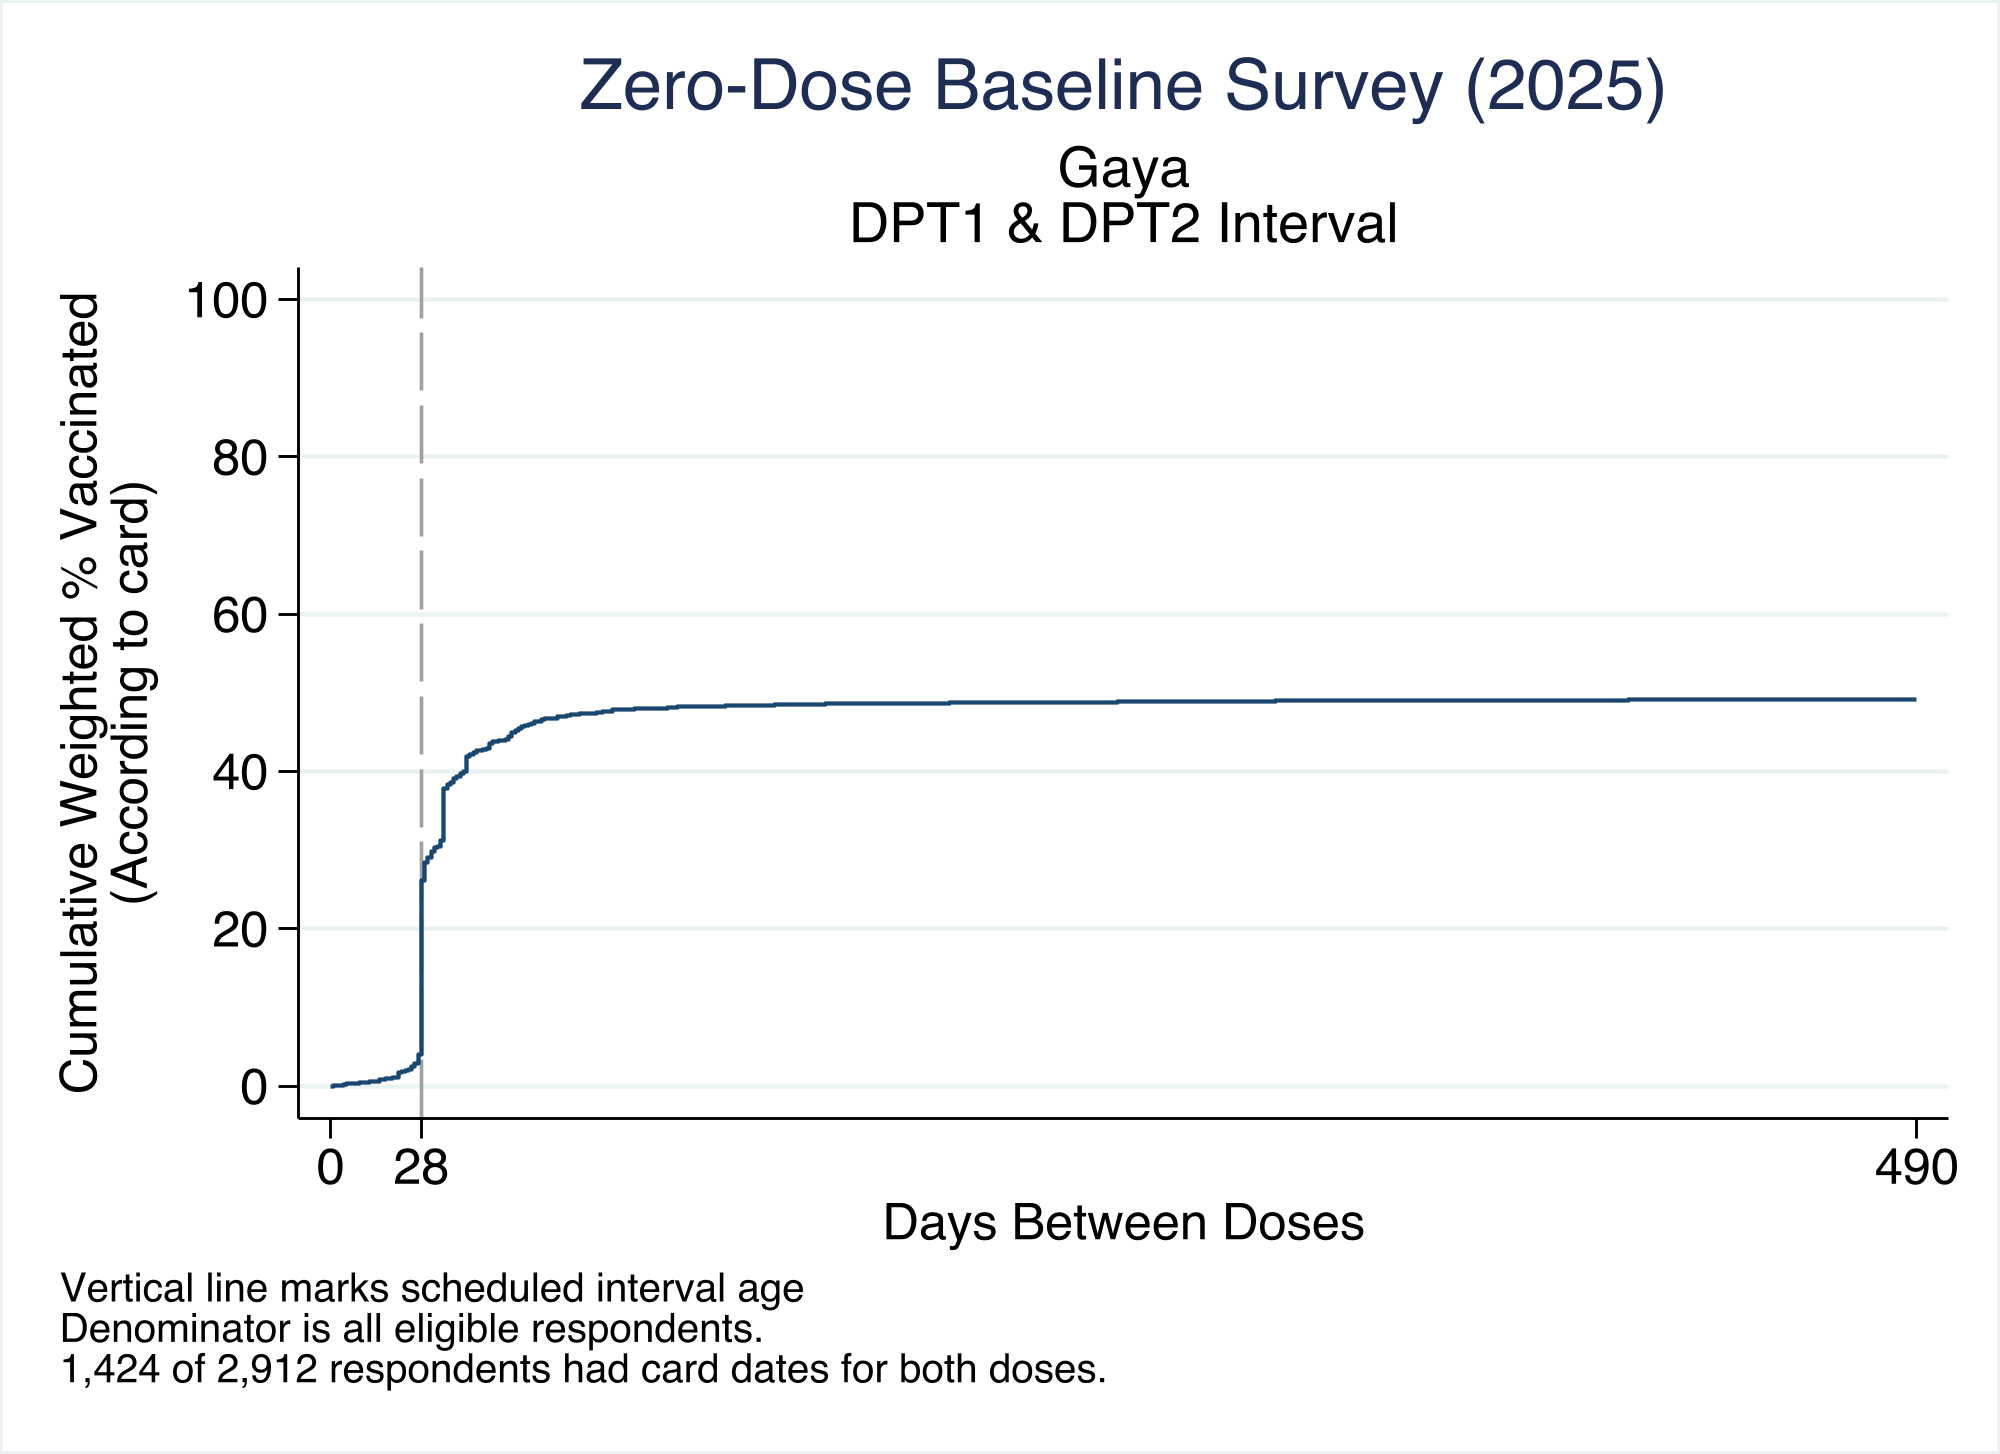
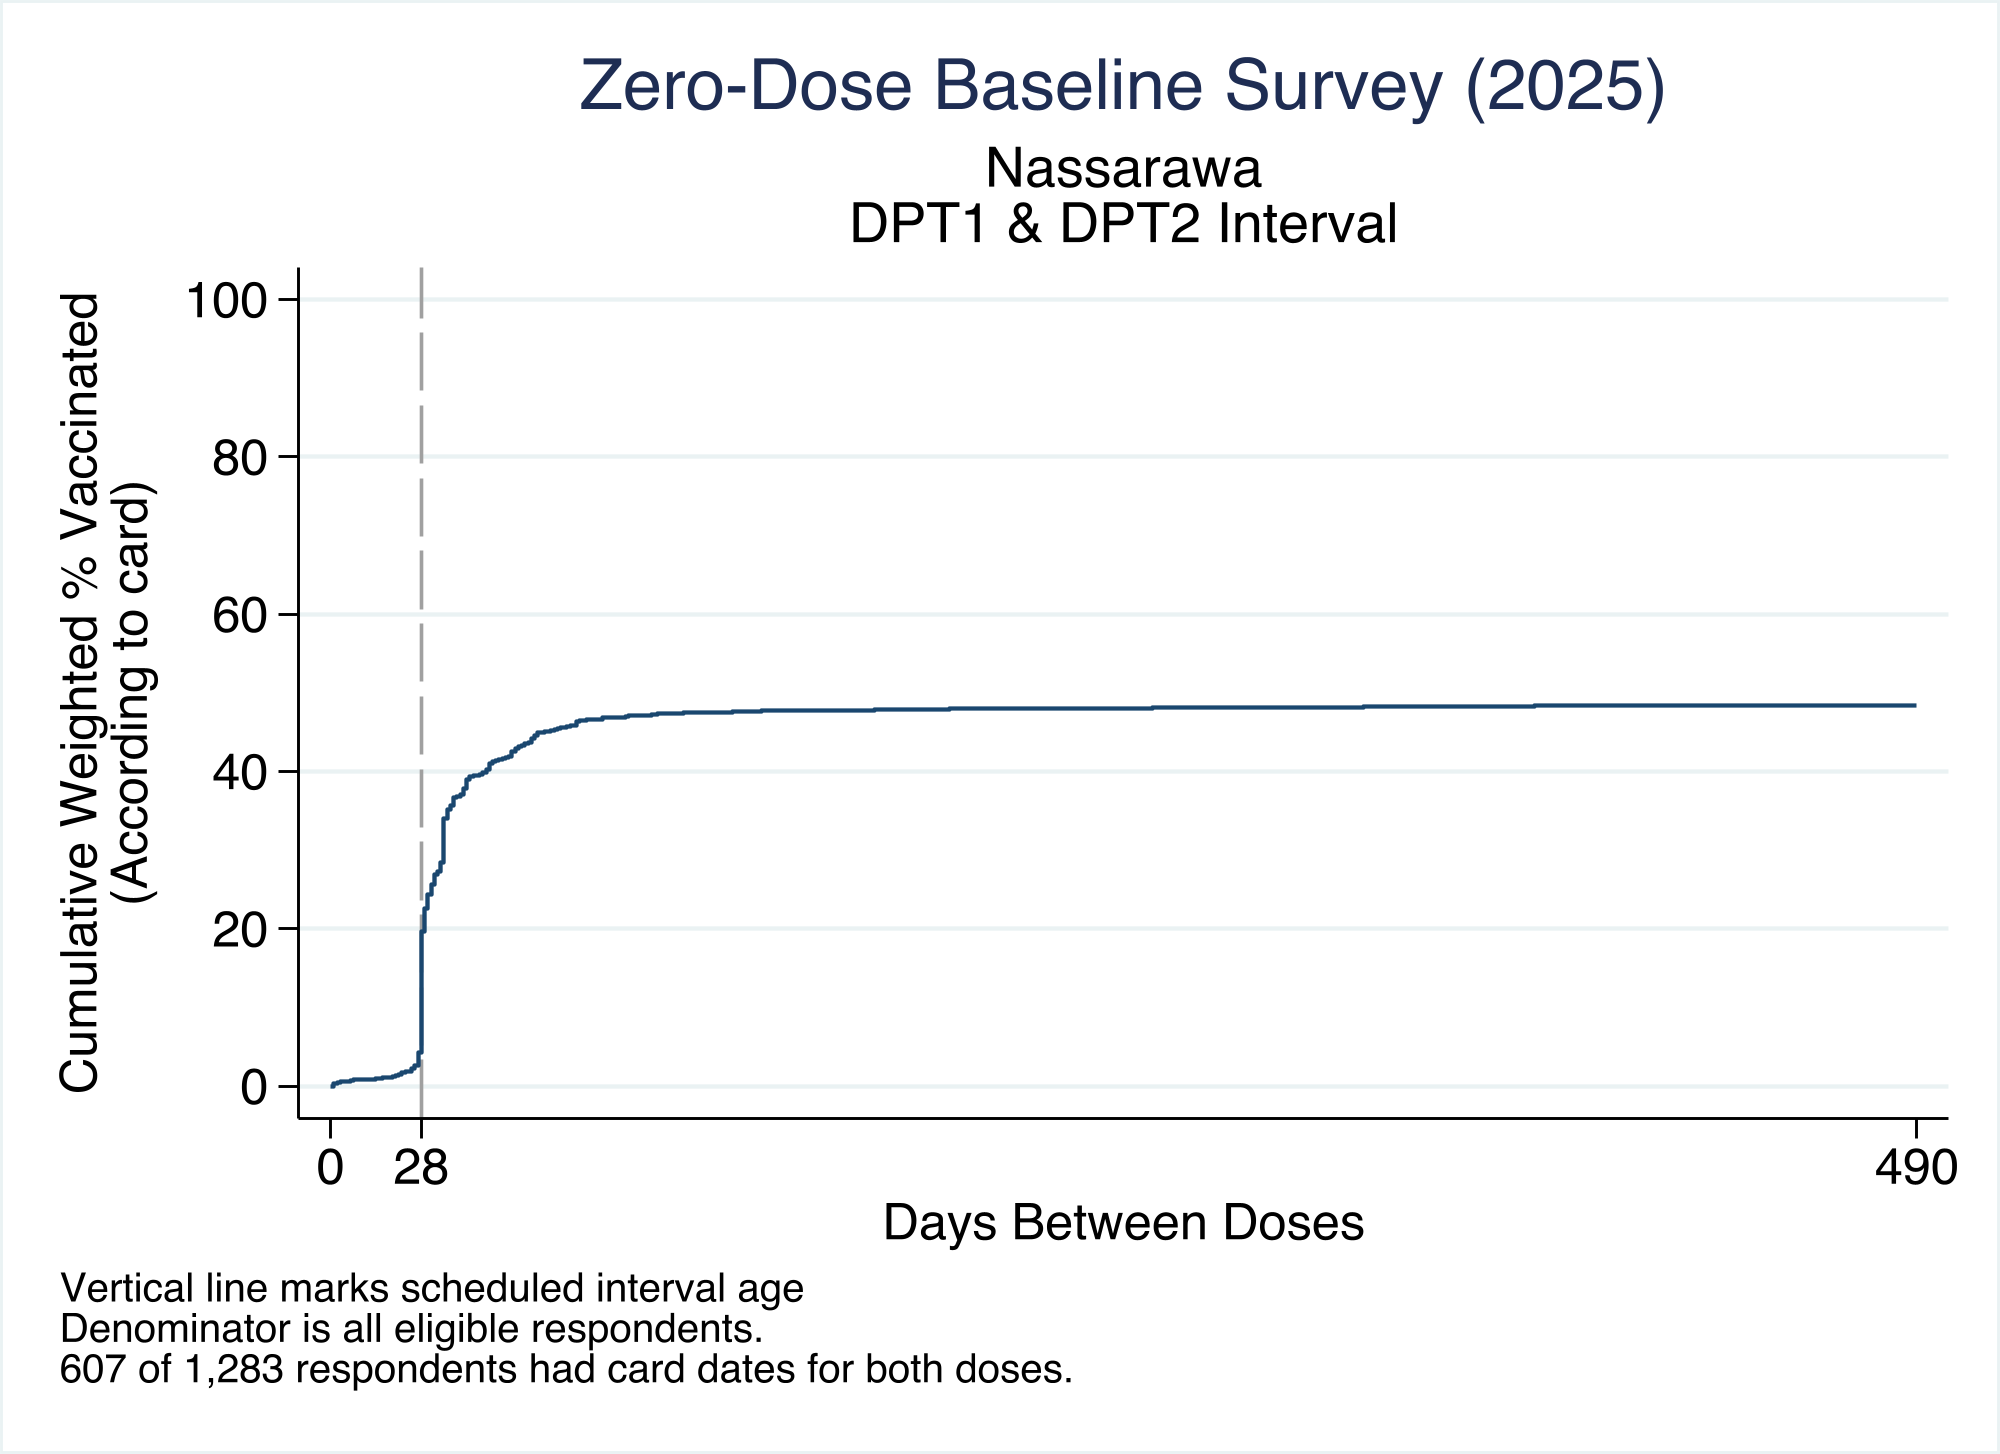
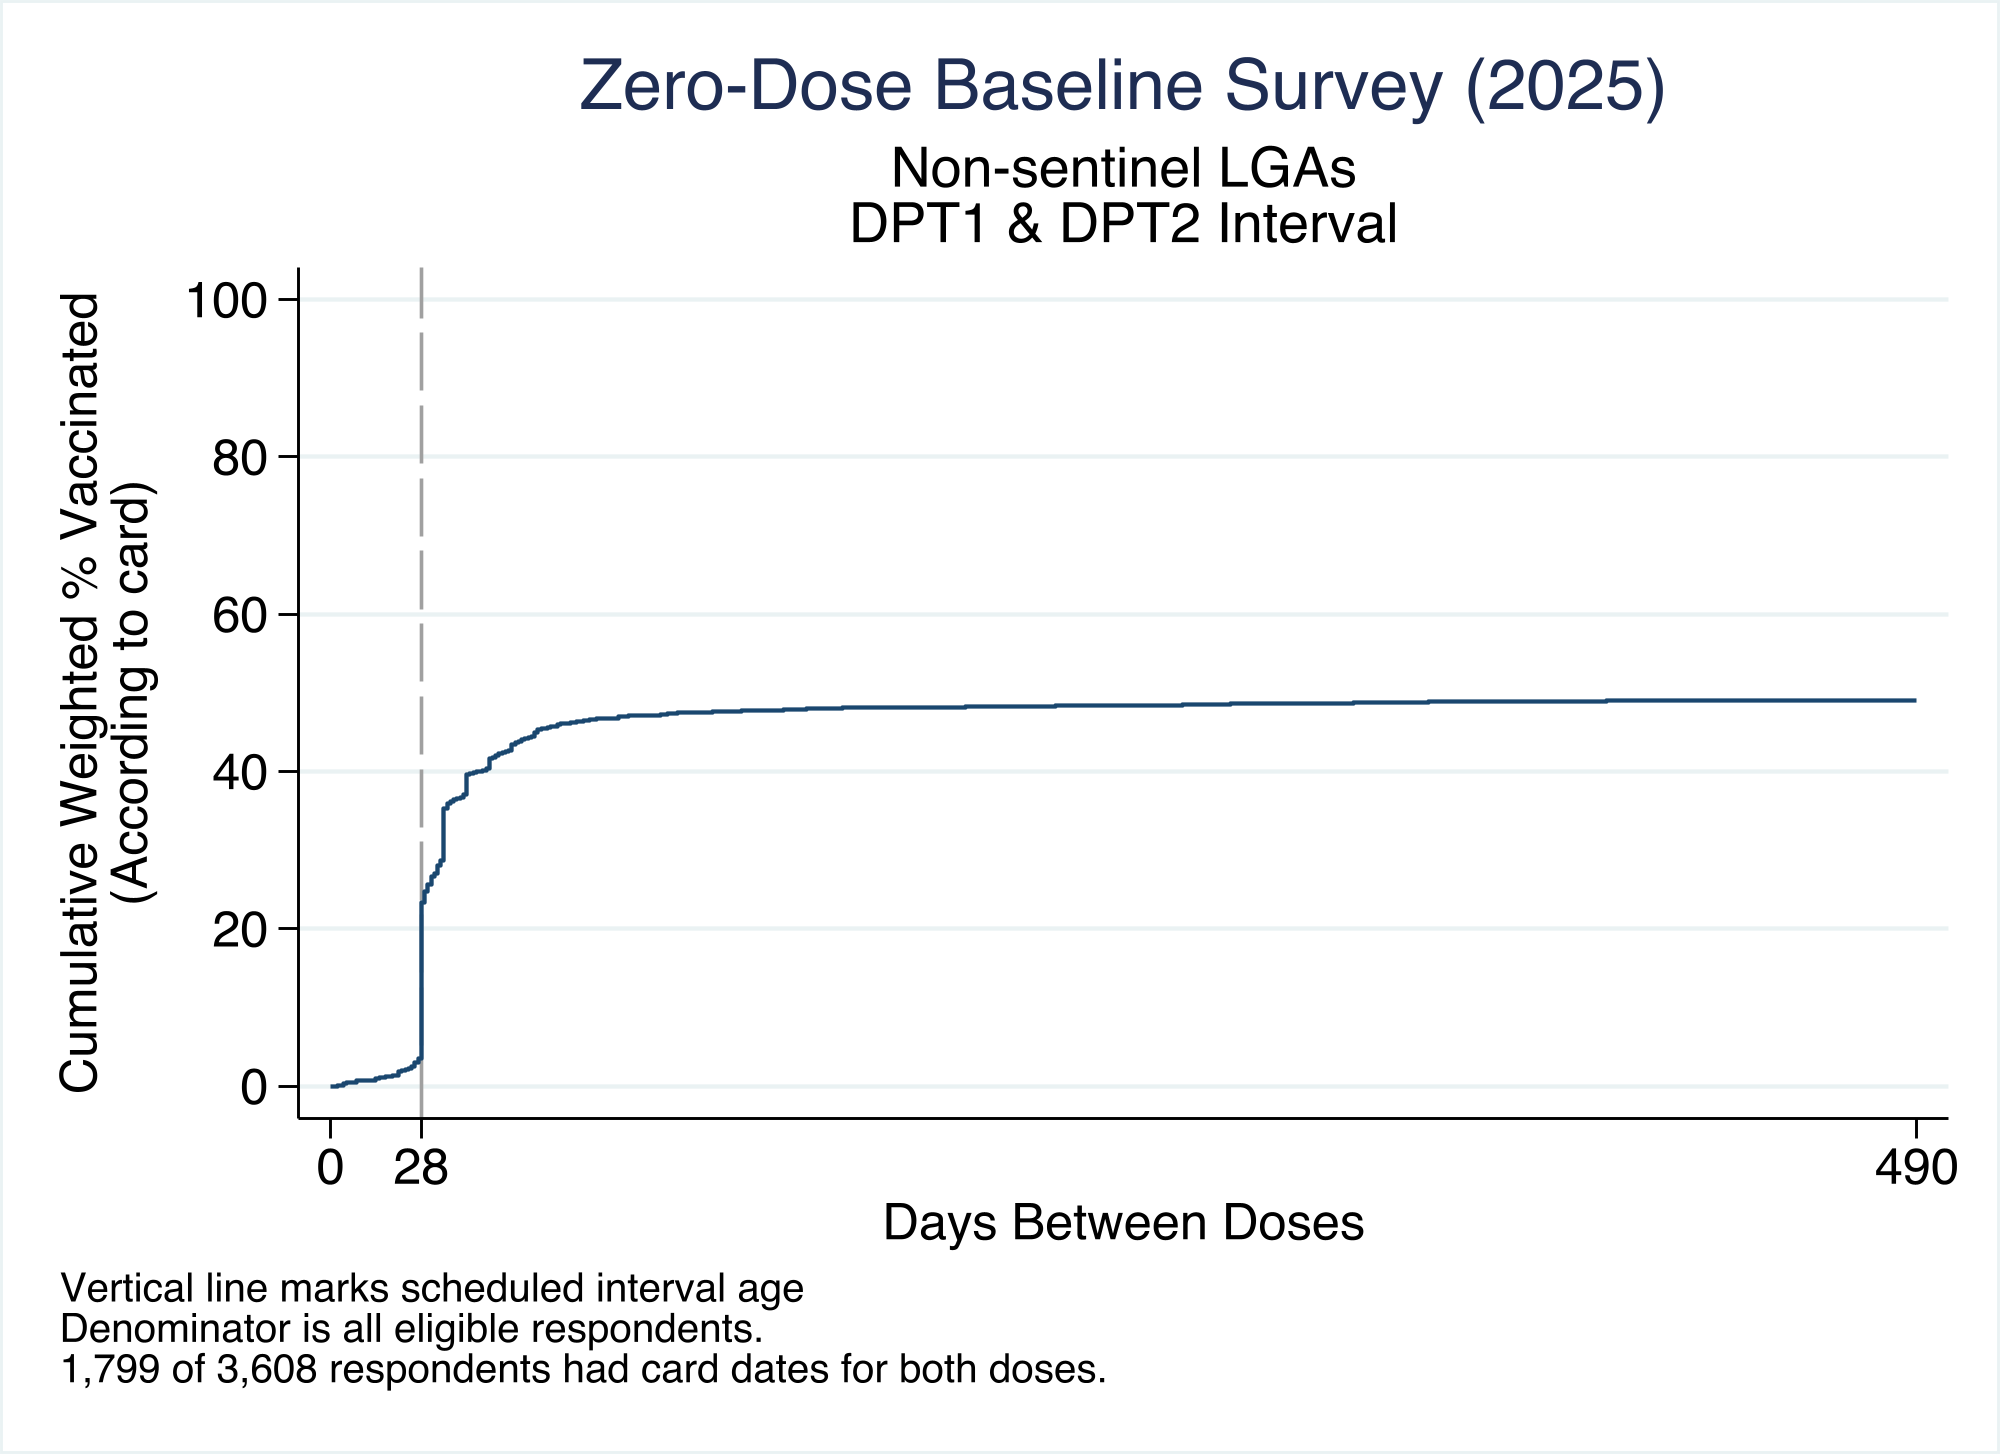
4.2.6 Missed Opportunities for Simultaneous Vaccination
RI_QUAL_07 RI_QUAL_08 RI_QUAL_09
A Missed Opportunity for Vaccination (MOV) happens when a child visits a health facility but does not receive all the vaccine doses for which they are eligible at the time of the visit. A Missed Opportunity for Simultaneous Vaccination (MOSV) is a specific type of MOV, which occurs when a child receives at least one vaccine during a visit but misses one or more other eligible doses. Health facility visit dates recorded in a HBR can be used to identify these MOSVs and track how often they occur.
Figure 4.33 and Figure 4.37 show clear differences in MOSVs for children aged 12-23 months between sentinel and non-sentinel LGAs, both in how frequently they occur and how frequently they are later corrected.
MOSVs for any vaccine dose are much more common in sentinel LGAs (Figure 4.33). Nassarawa displays the highest rate at 79.8%; Gabasawa and Gaya follow closely with 74.1% and 73.6% respectively, while non-sentinel LGAs show a lower rate at 60.7%.
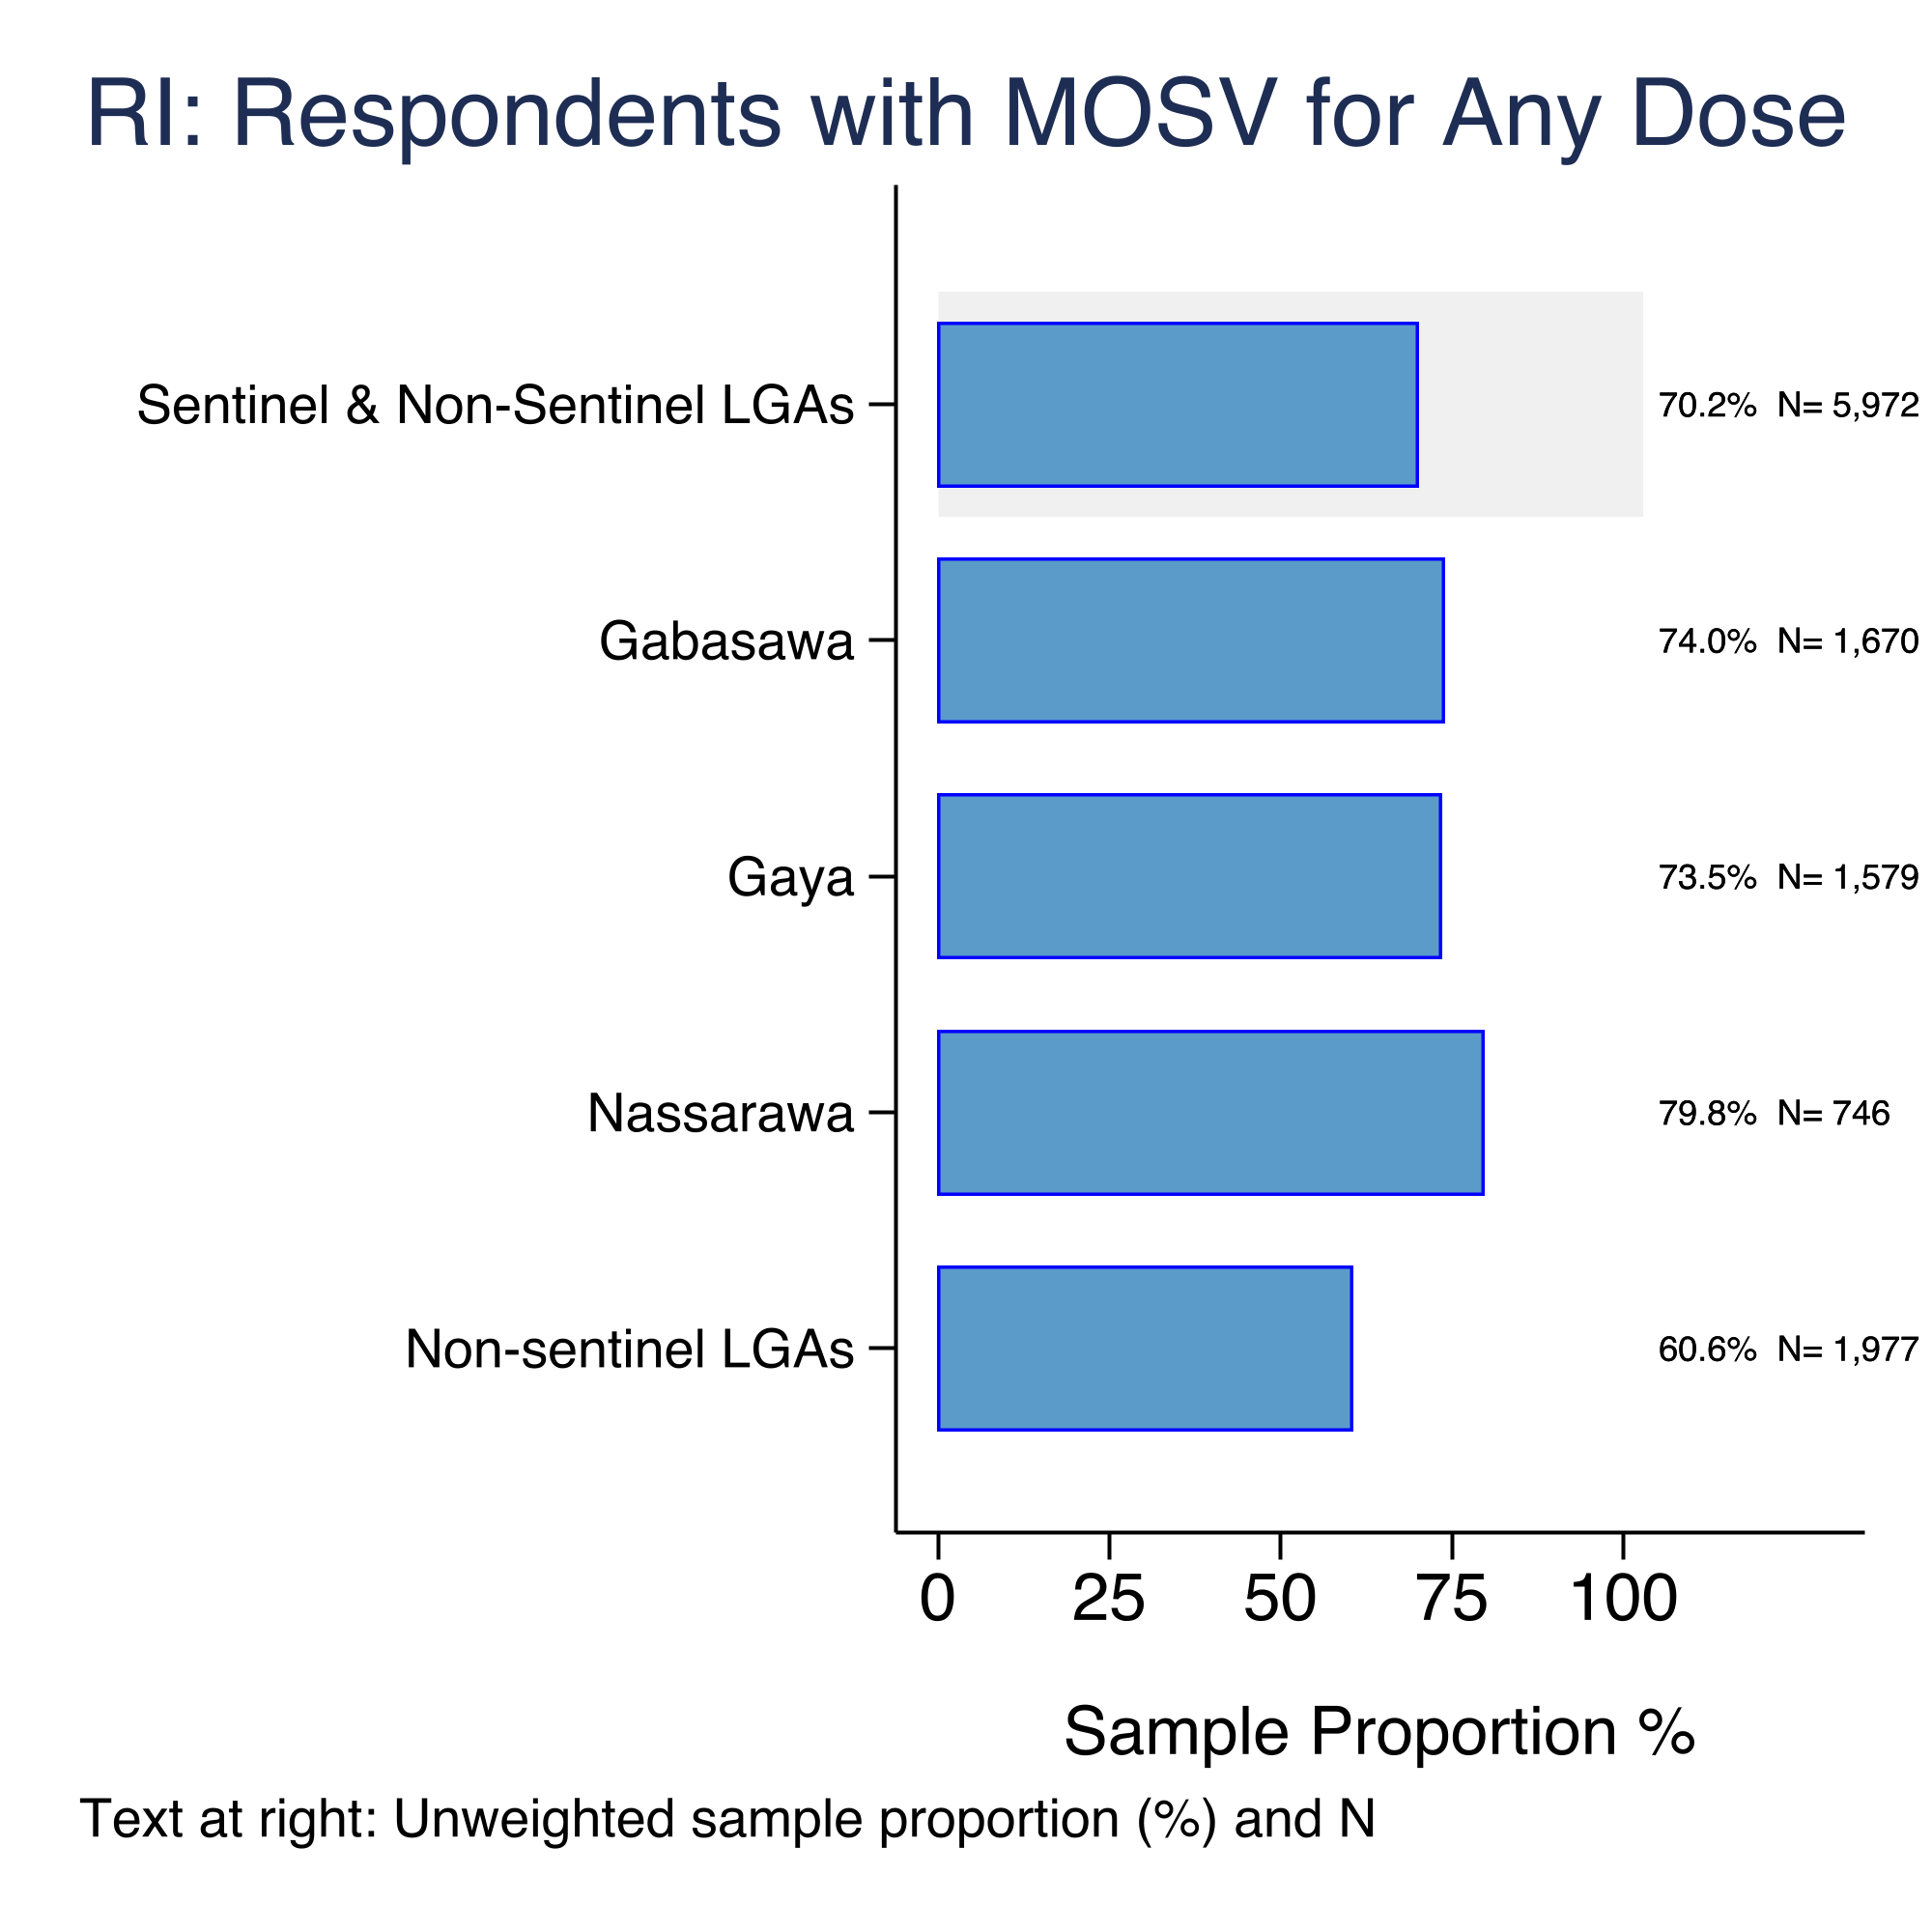
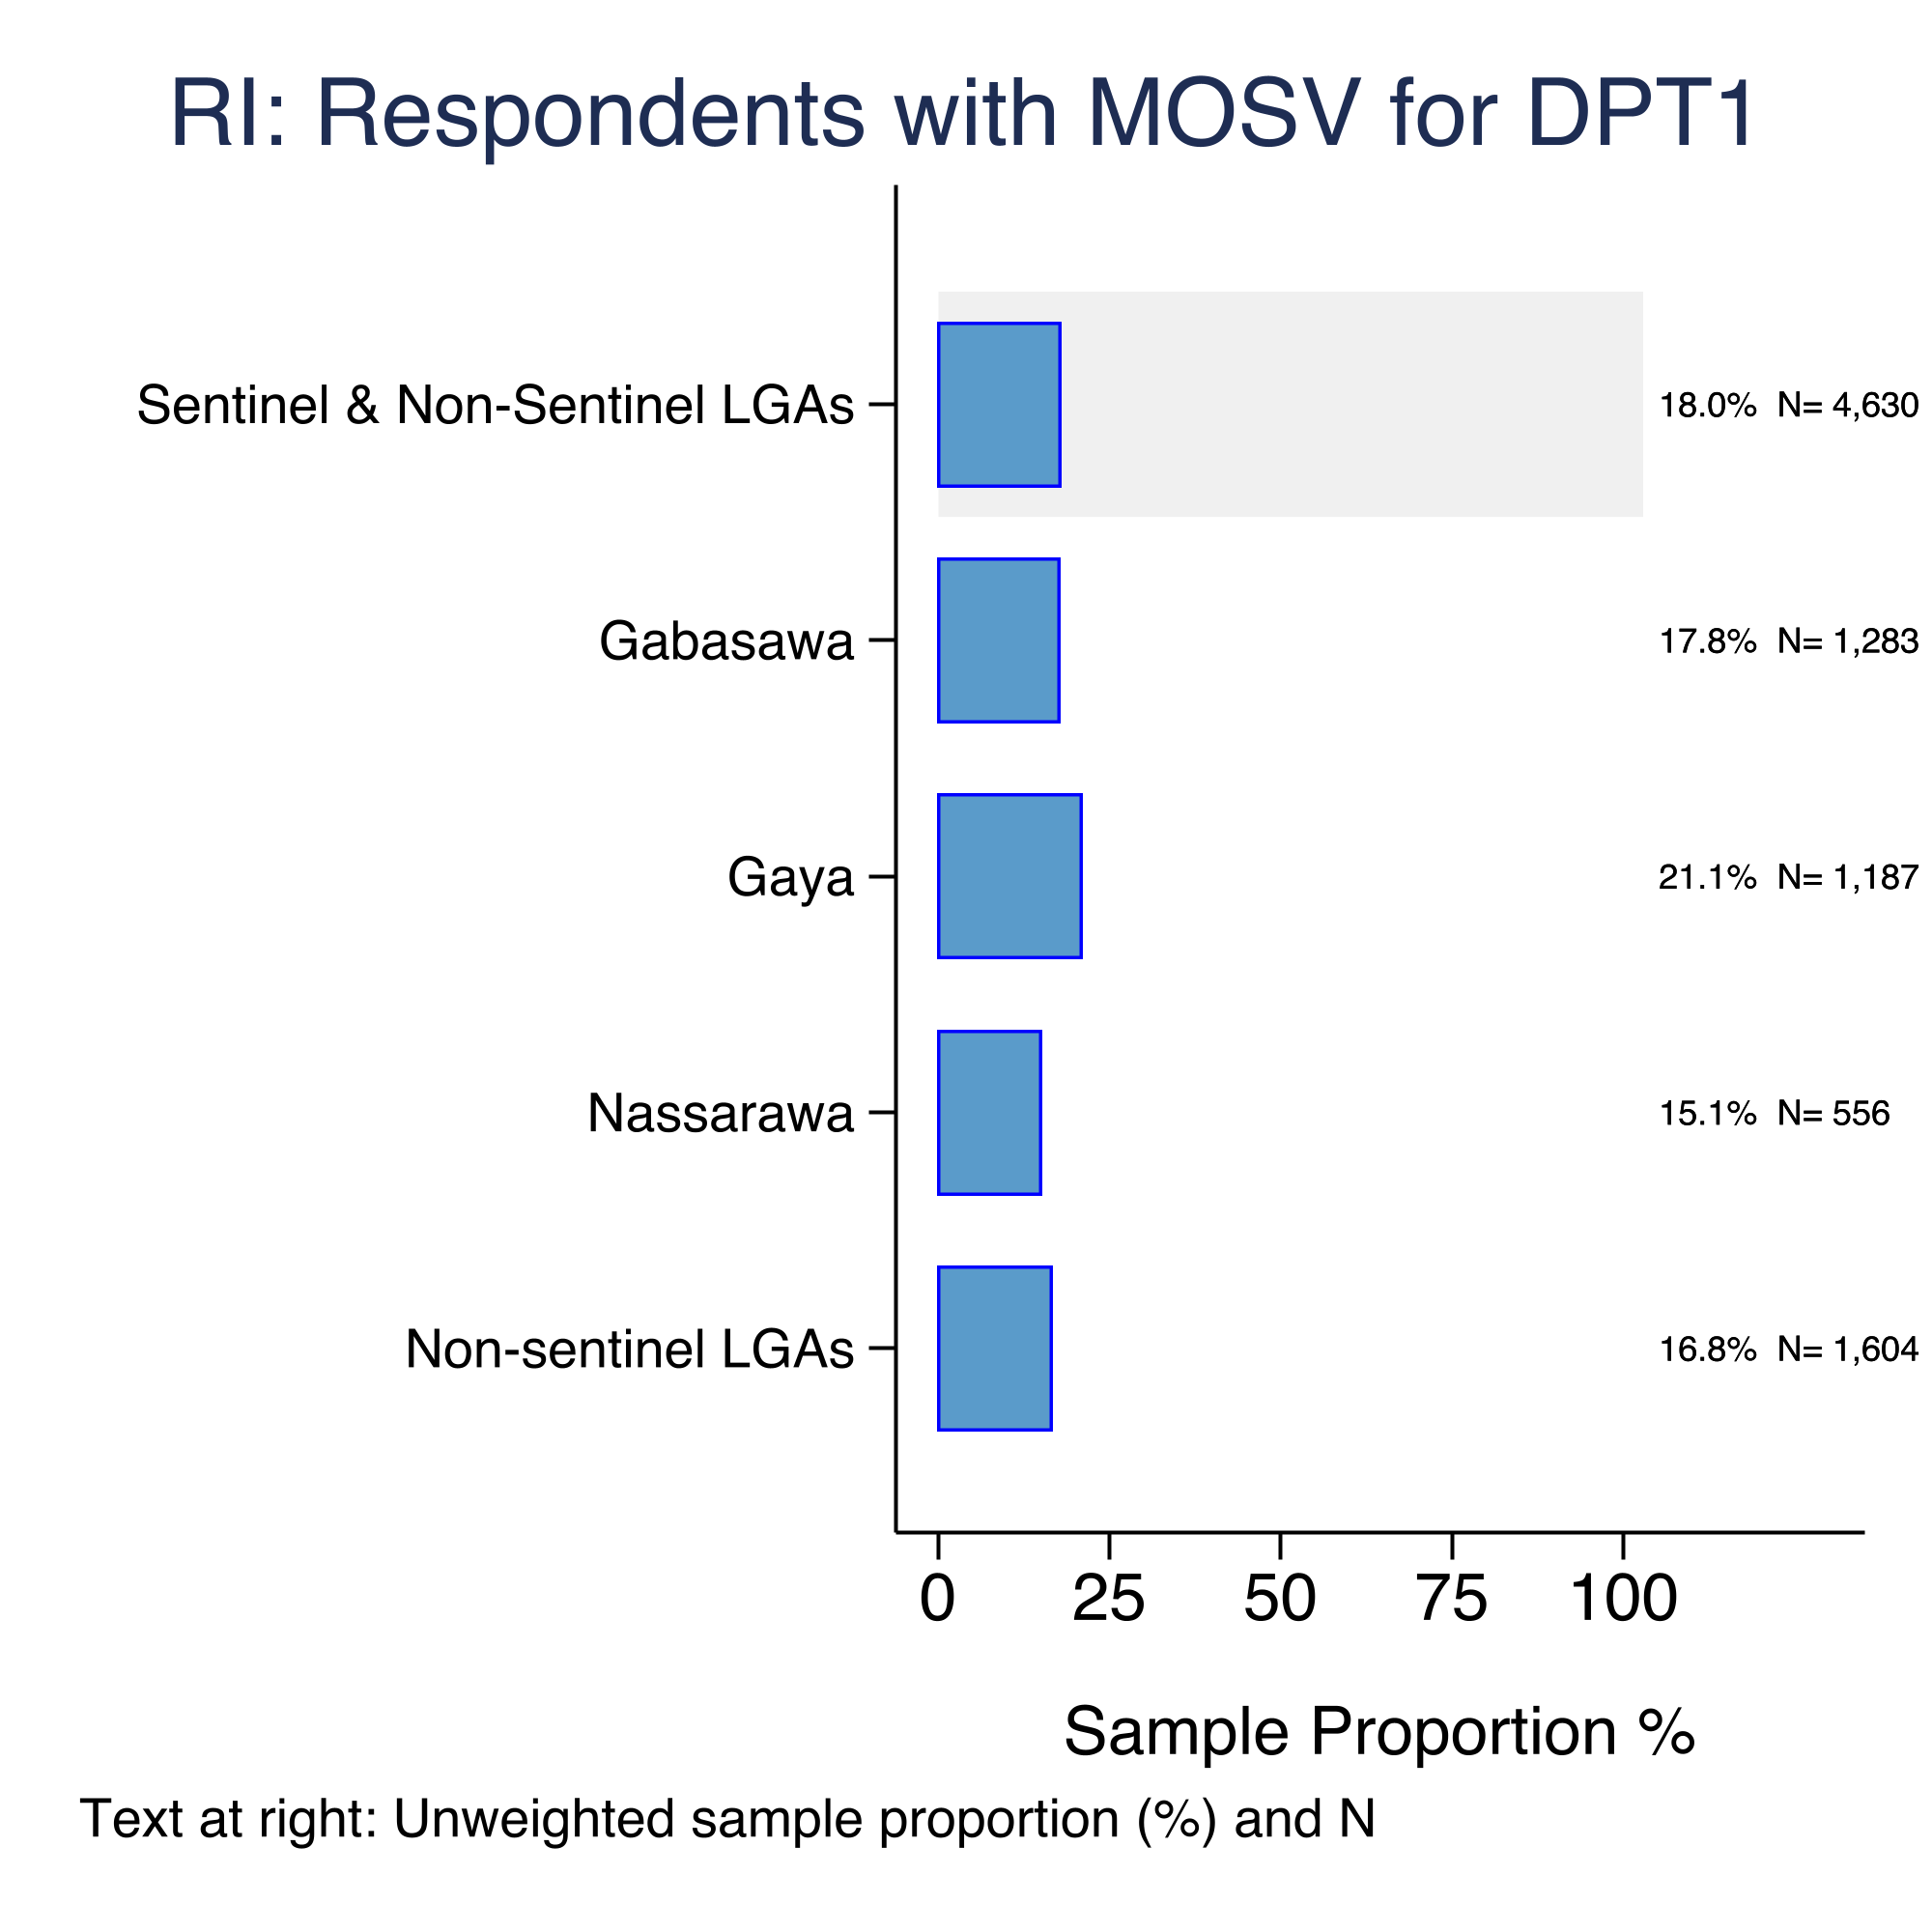
When a child first visits a health facility after becoming eligible for a vaccine, there are two possible outcomes: either the child receives the dose at the first eligible opportunity, or they experience a MOSV (Kazi et al. 2024). If the dose is later given at another visit, the MOSV is considered corrected; if the dose still has not been administered by the time of the survey, the MOSV is considered uncorrected (Kazi et al. 2024).
When focusing on the proportion of children aged 12-23 months with MOSVs who eventually had all their missed doses corrected, the pattern observed above reverses (Figure 4.37). The percentage of respondents with MOSVs that had all MOSVs later corrected is much higher in non-sentinel (72.6%) than sentinel LGAs (Gabasawa at 38.3%, Gaya at 36.3%, and Nassarawa at just 21.5%).
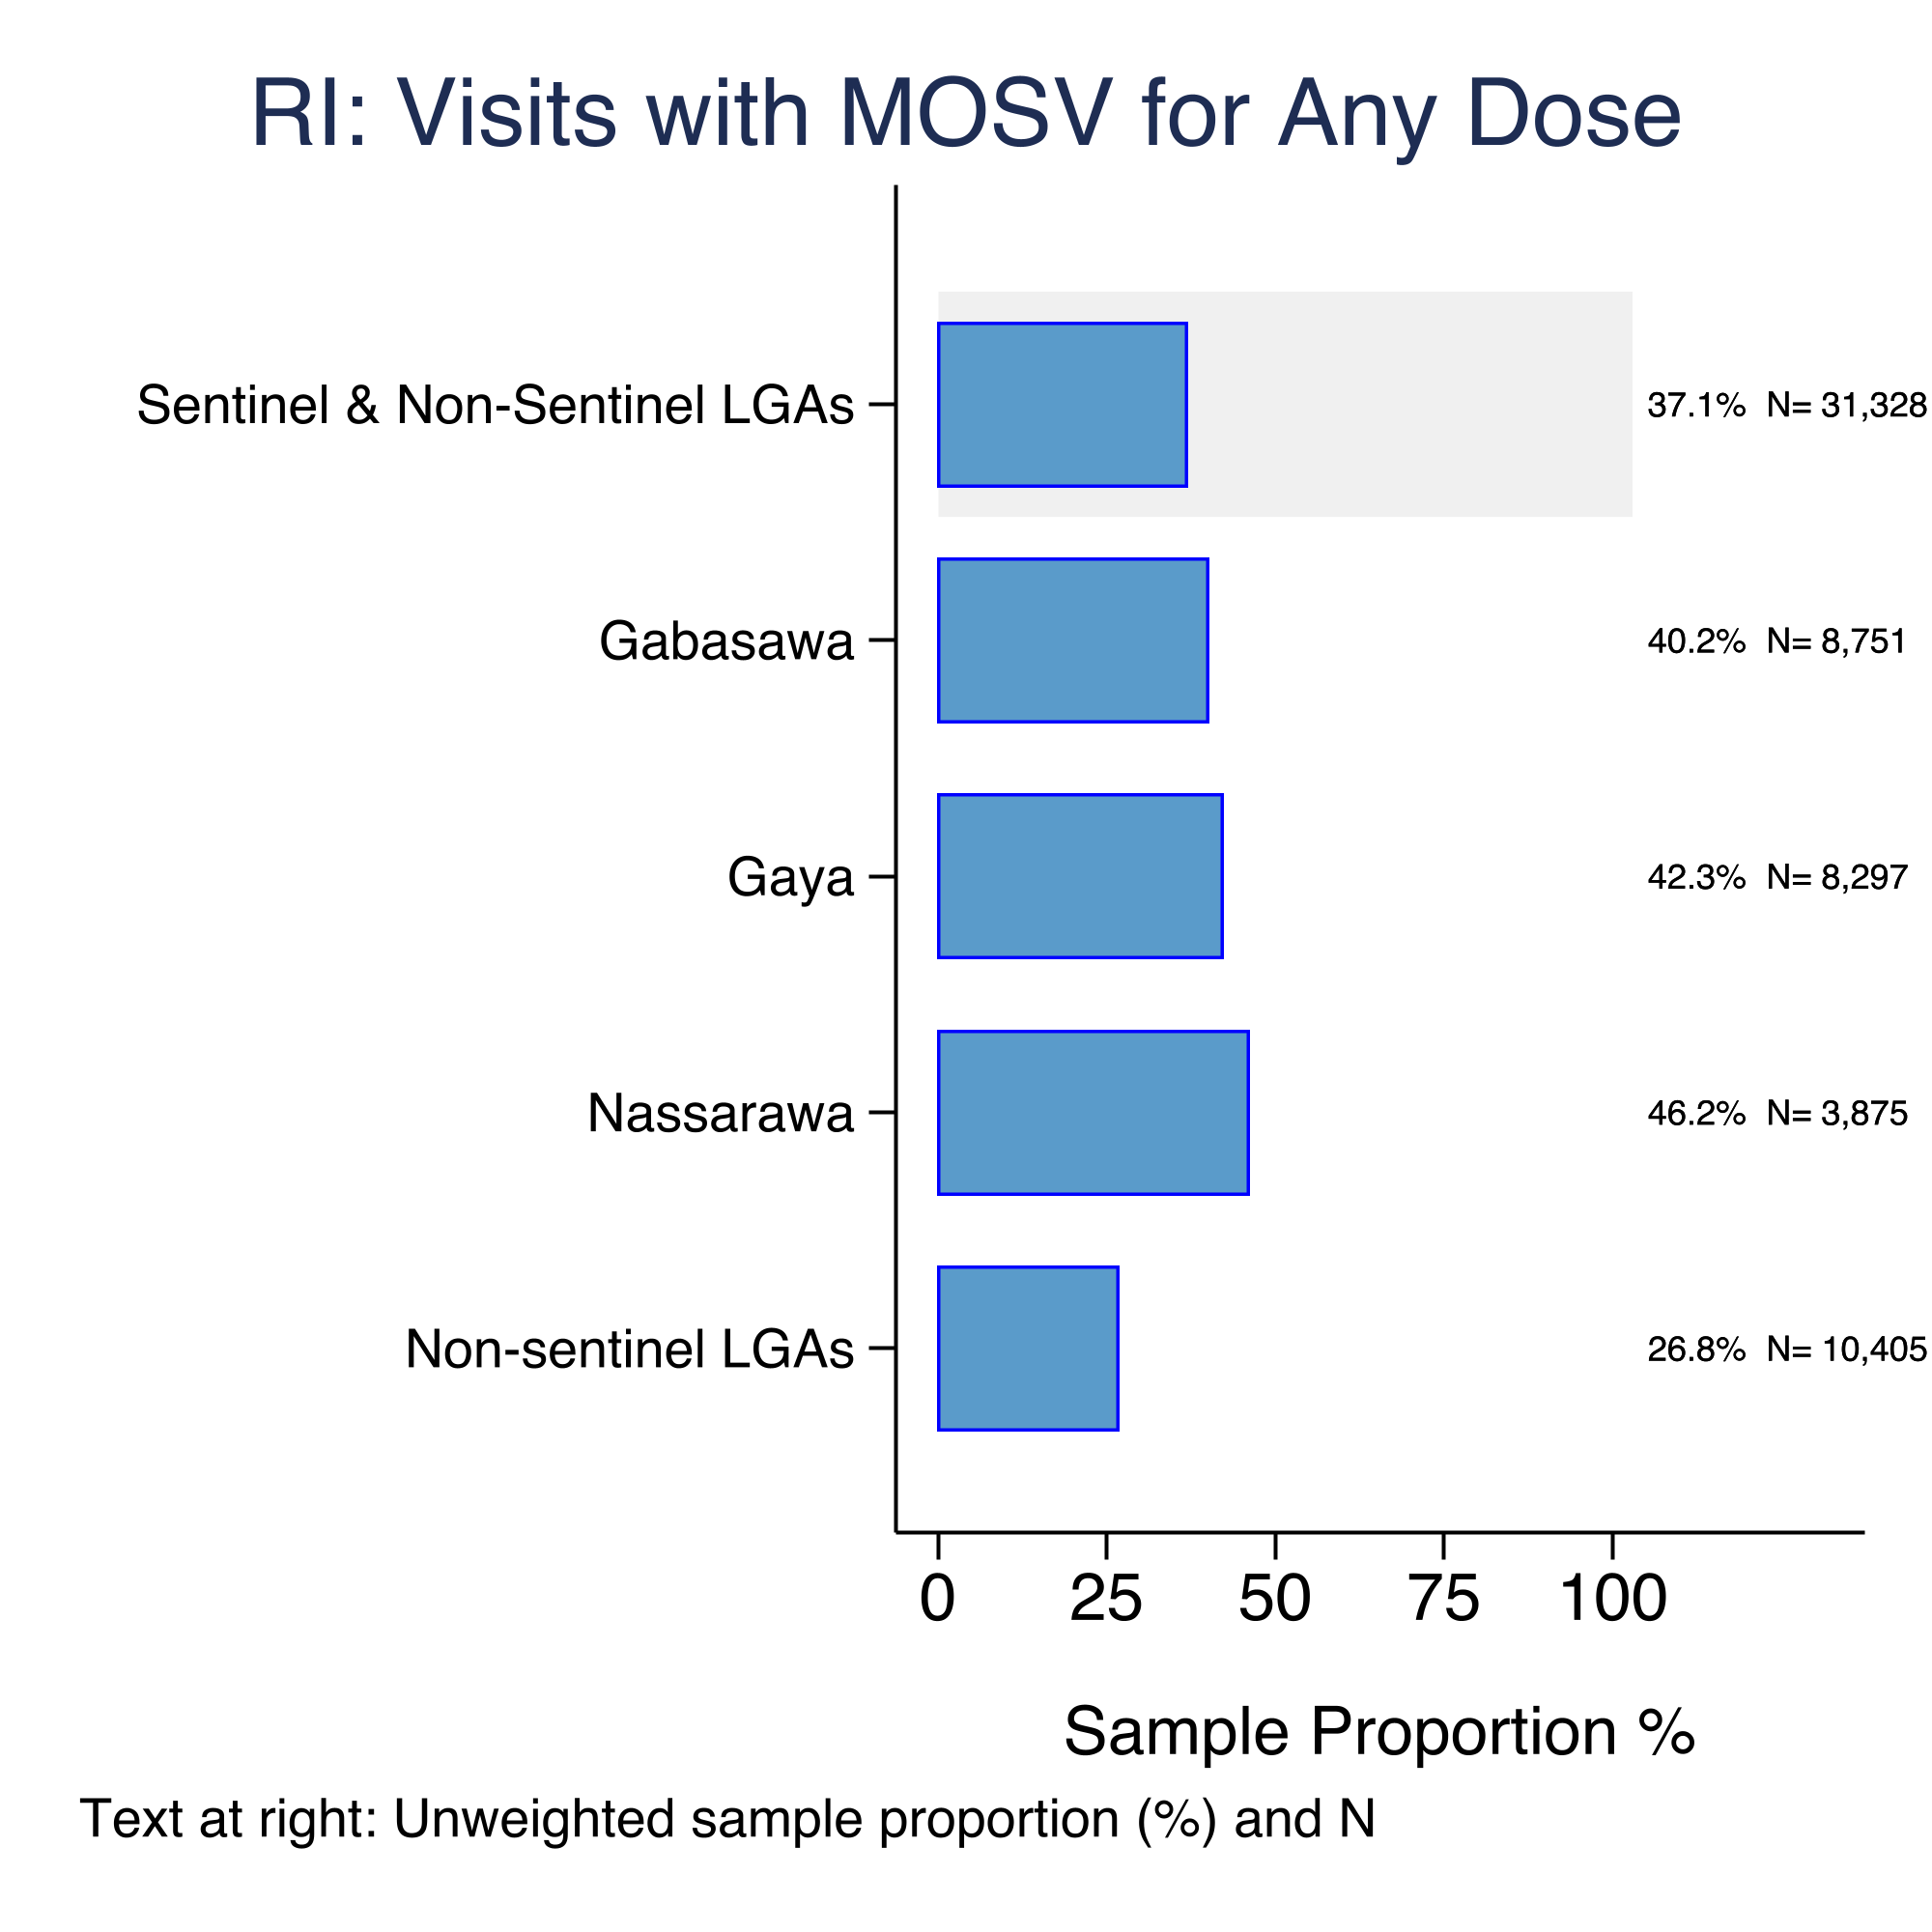
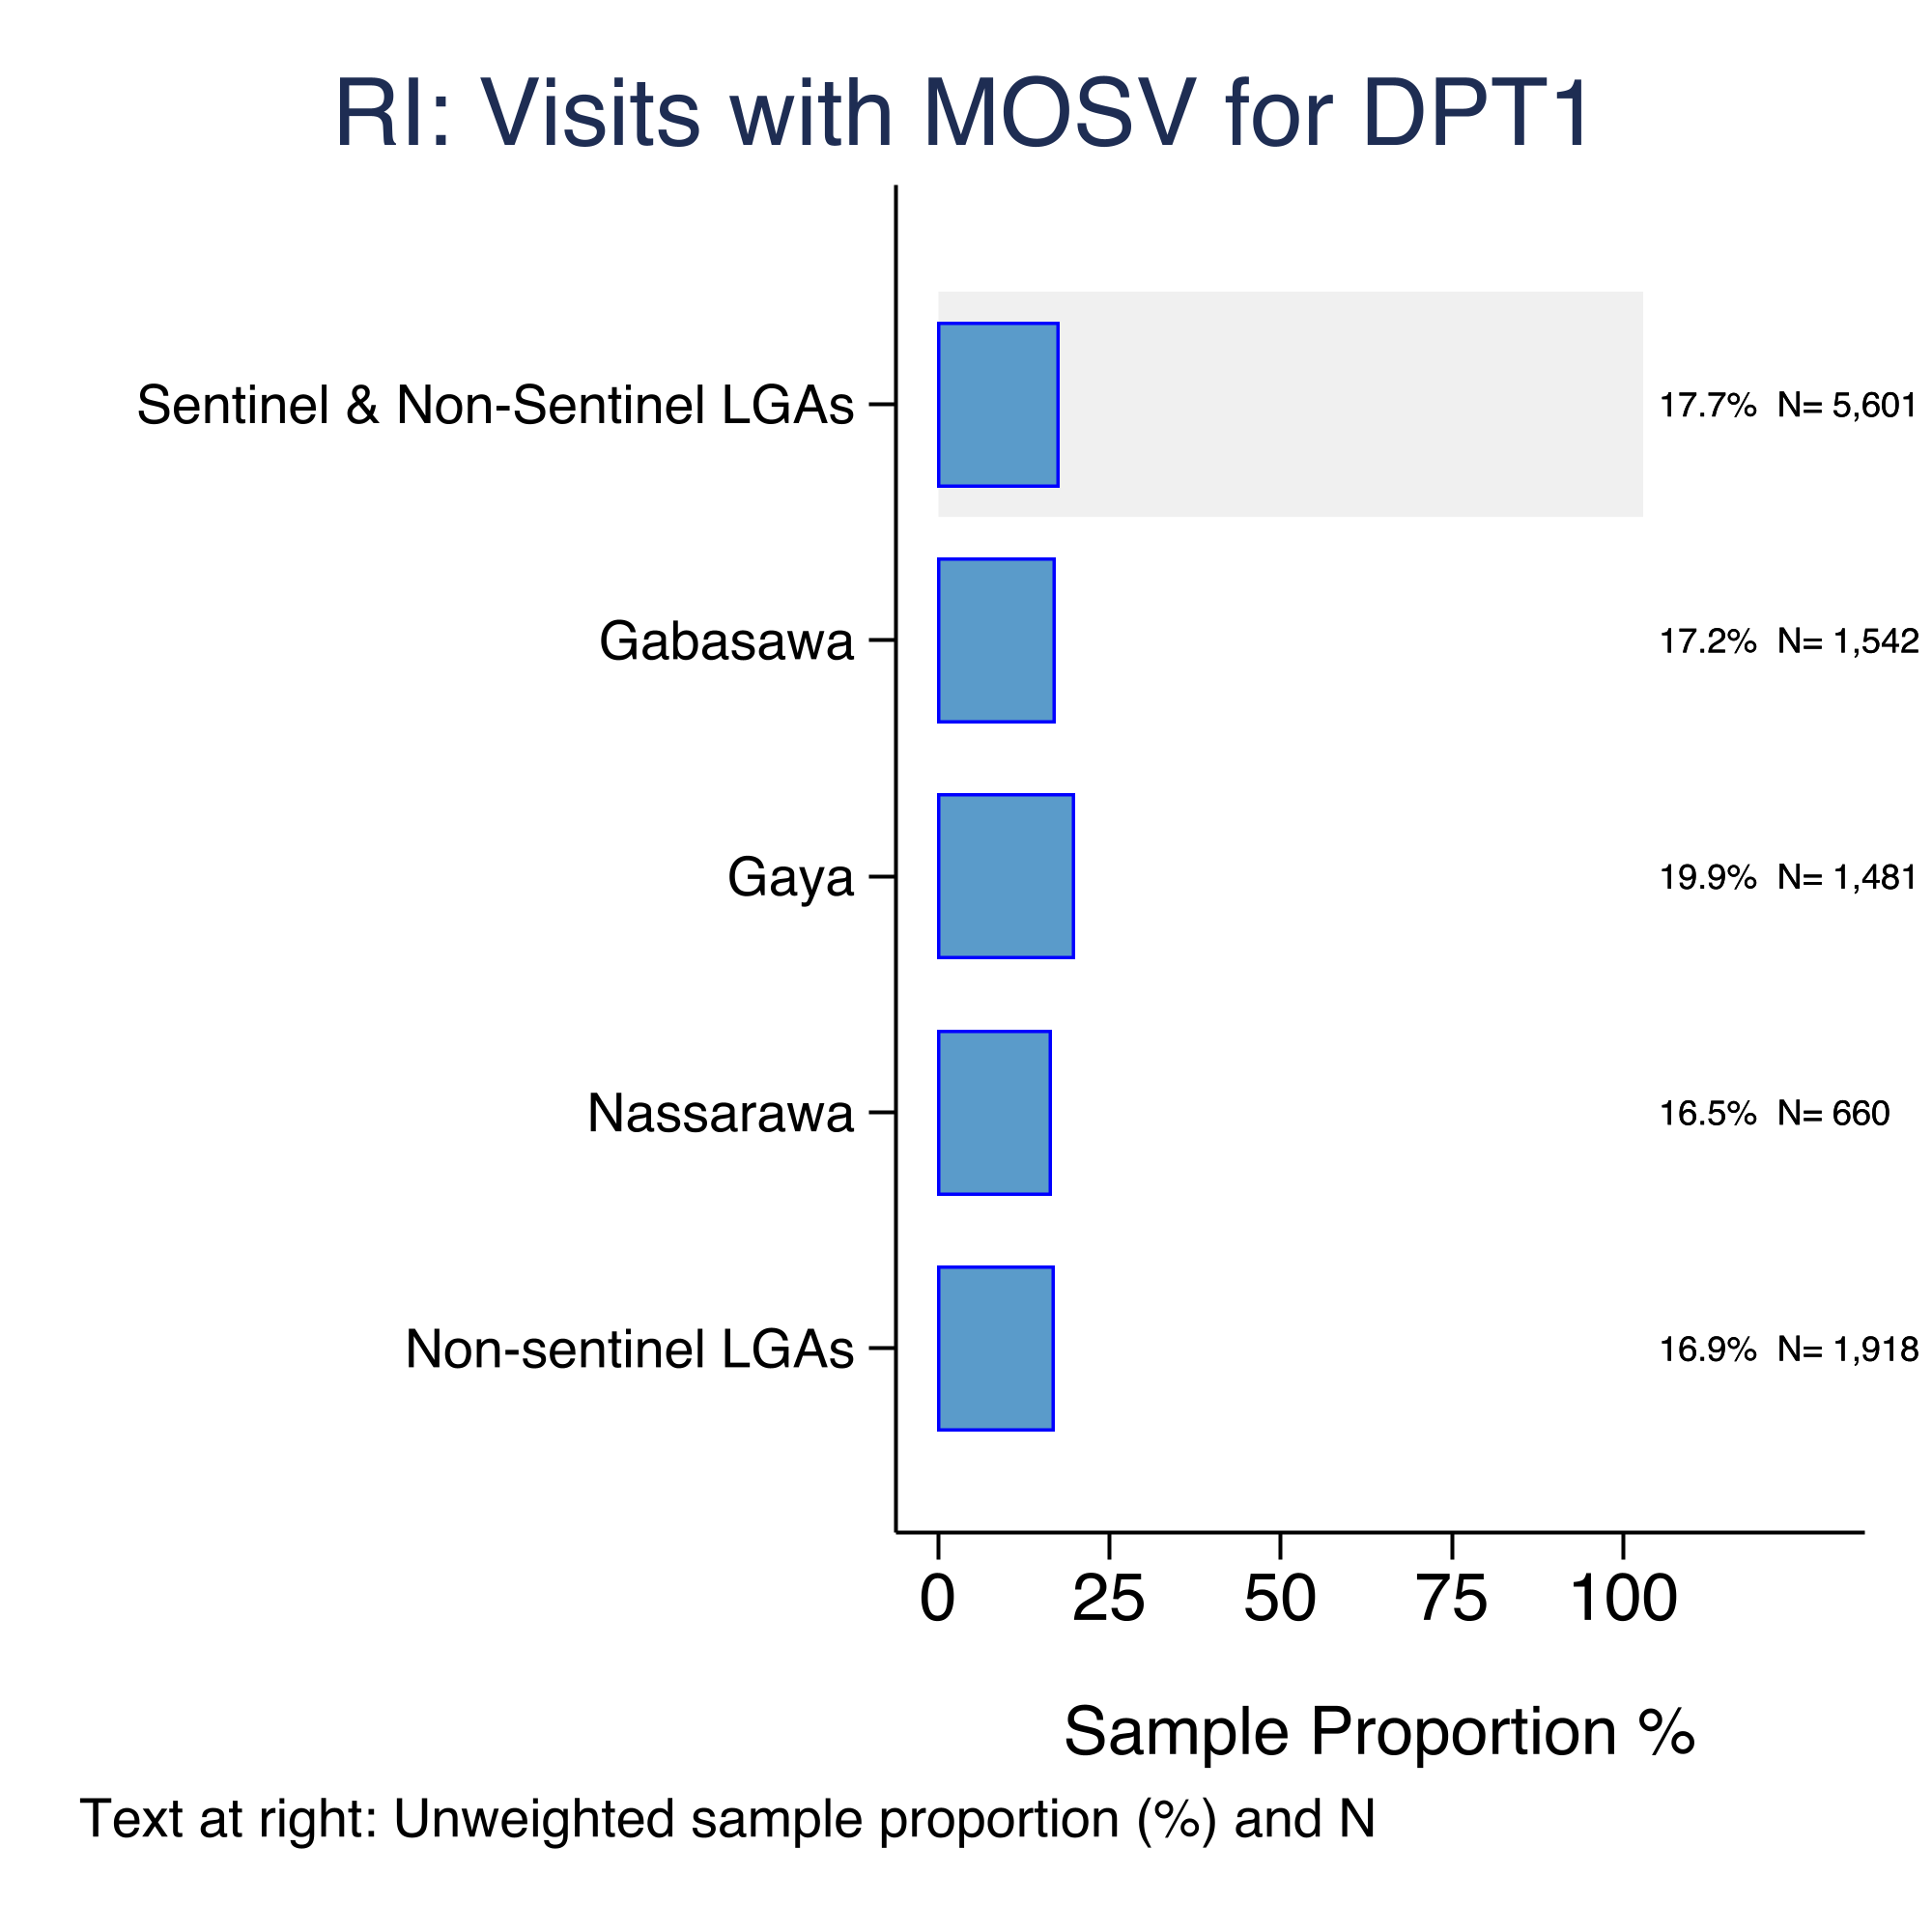
Overall, caregivers in sentinel LGAs (particularly Nassarawa) are not only more likely to miss opportunities for simultaneous vaccination, but also less likely to correct them compared to caregivers in non-sentinel LGAs. One possible reason is Nassarawa’s higher early vaccination coverage, which creates more opportunities for children to miss doses as they move through the schedule.
Figure 4.34 shows MOSVs DPT-1. Reassuringly, the proportion of DPT-1 MOSVs that are later corrected is very high across all LGAs, with Gaya leading at 99.6% of missed DPT-1 doses eventually corrected (Figure 4.38).
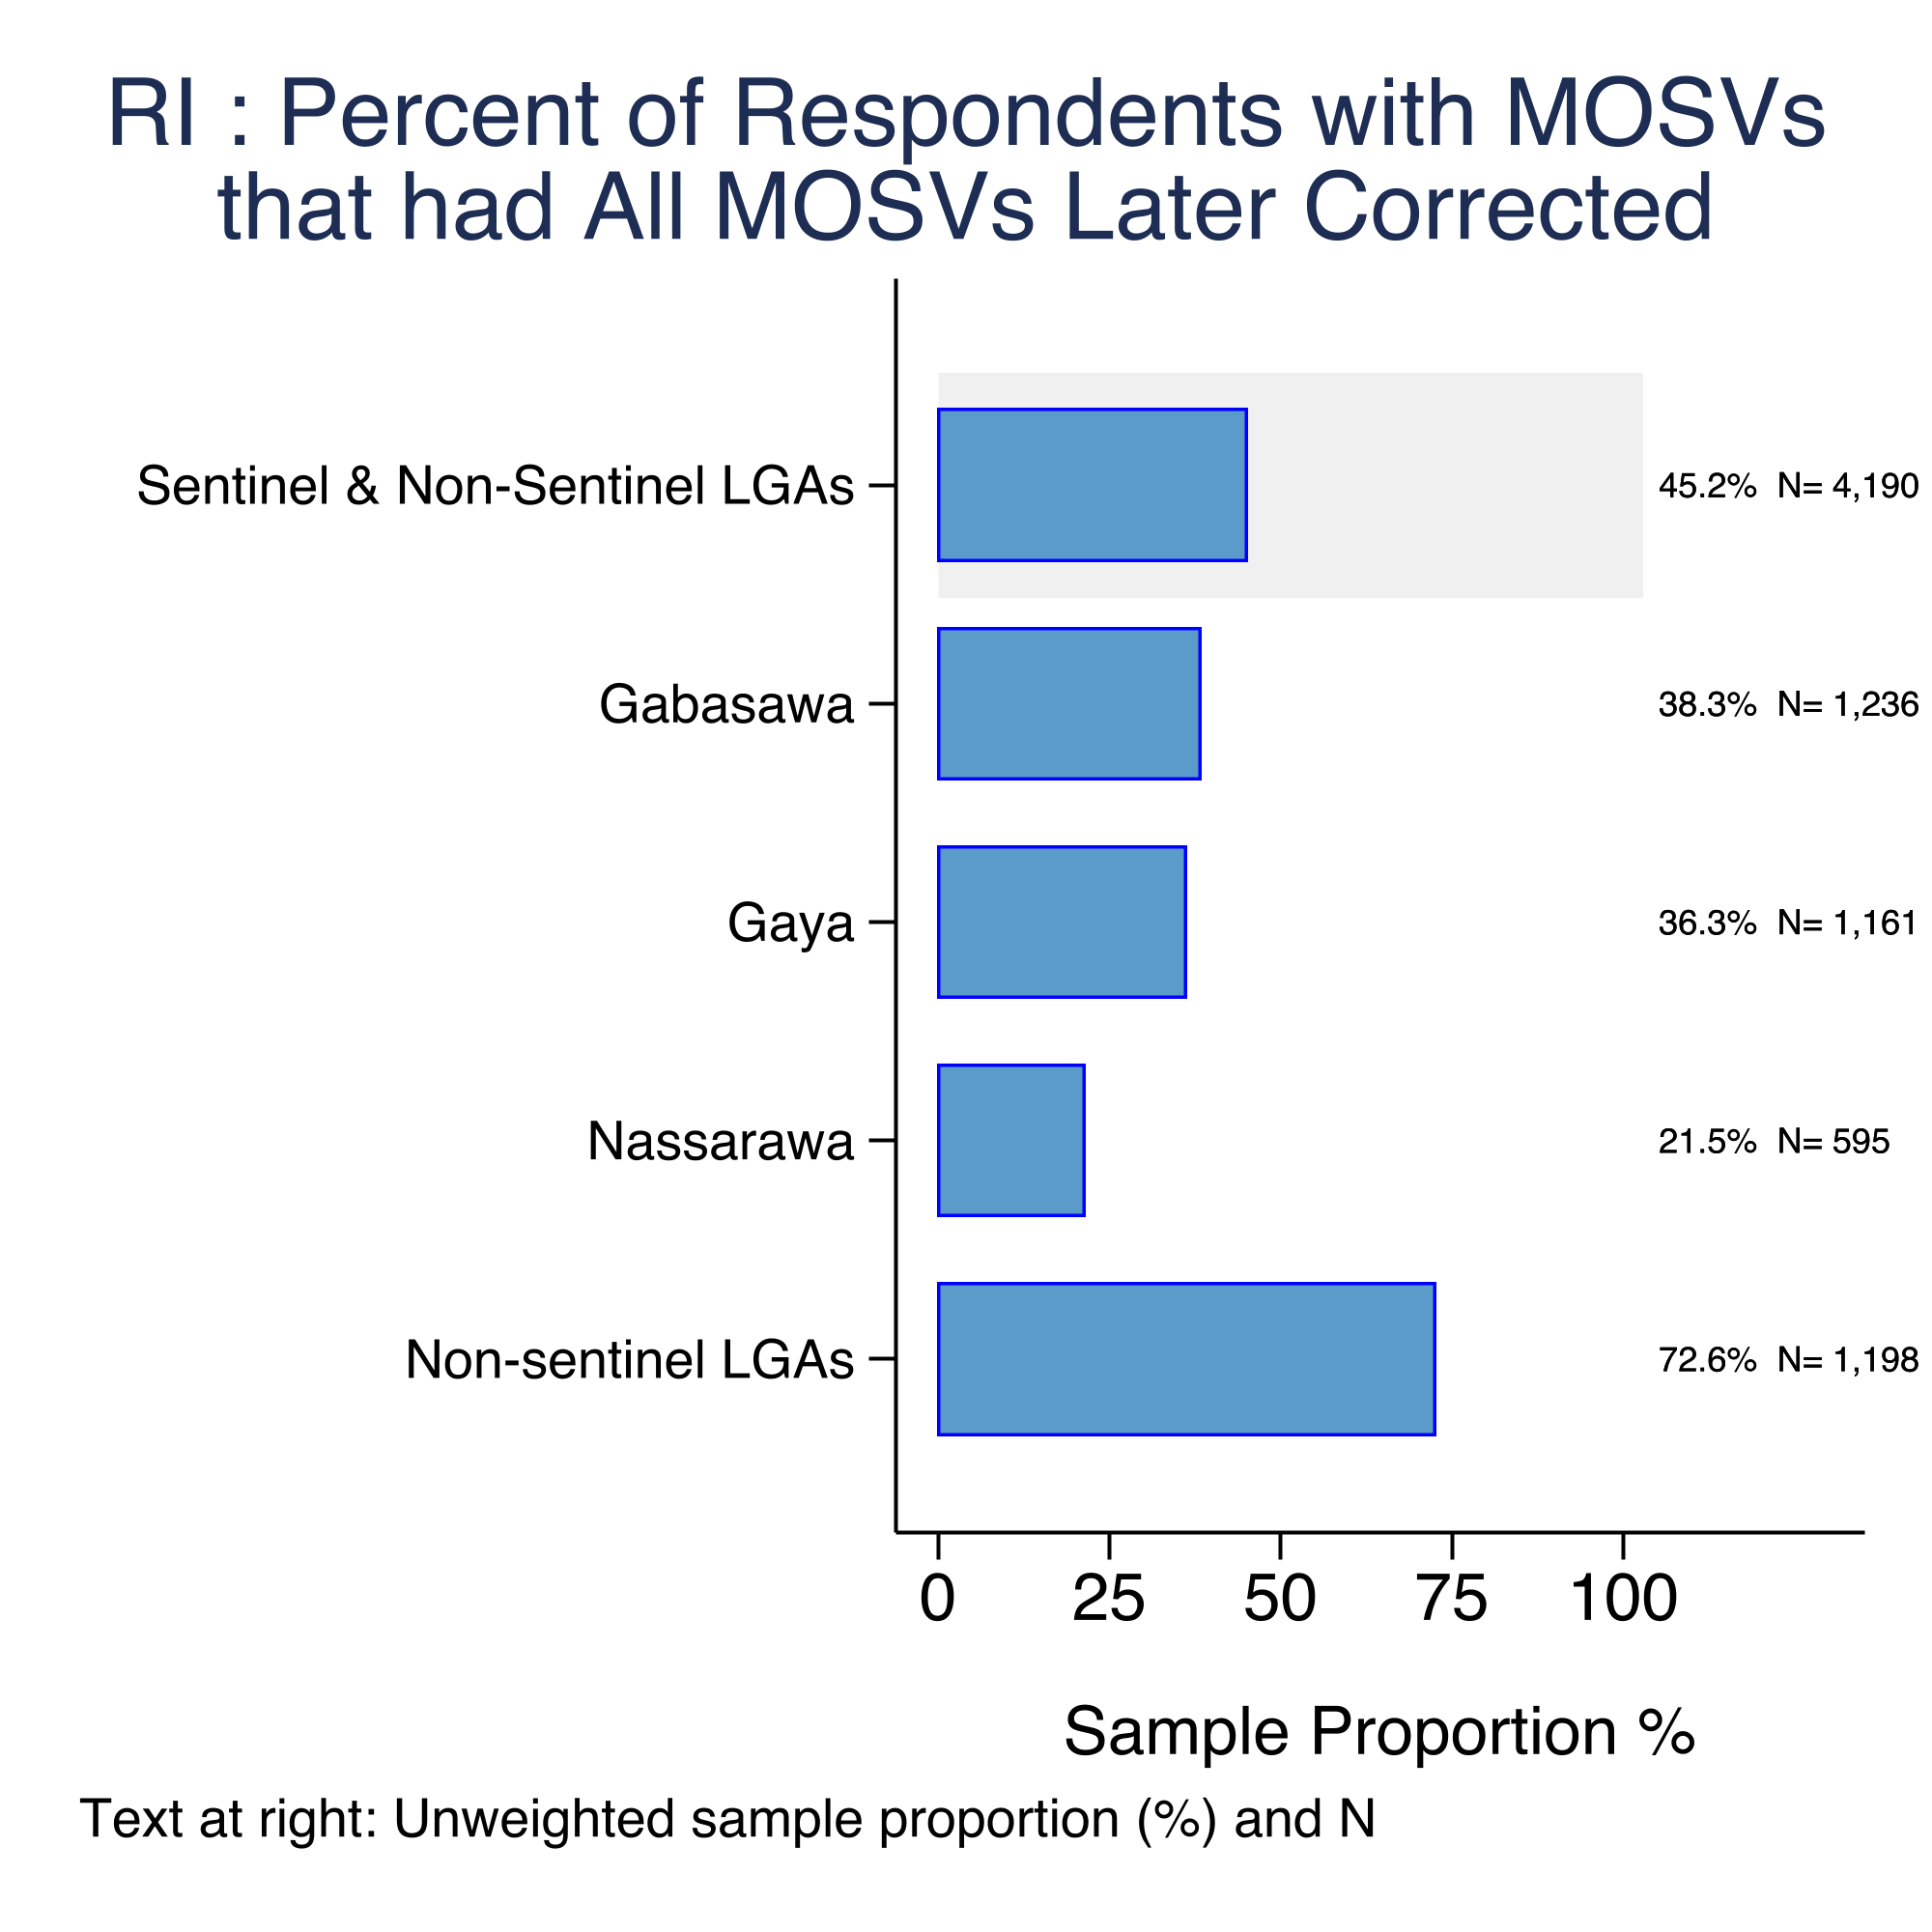
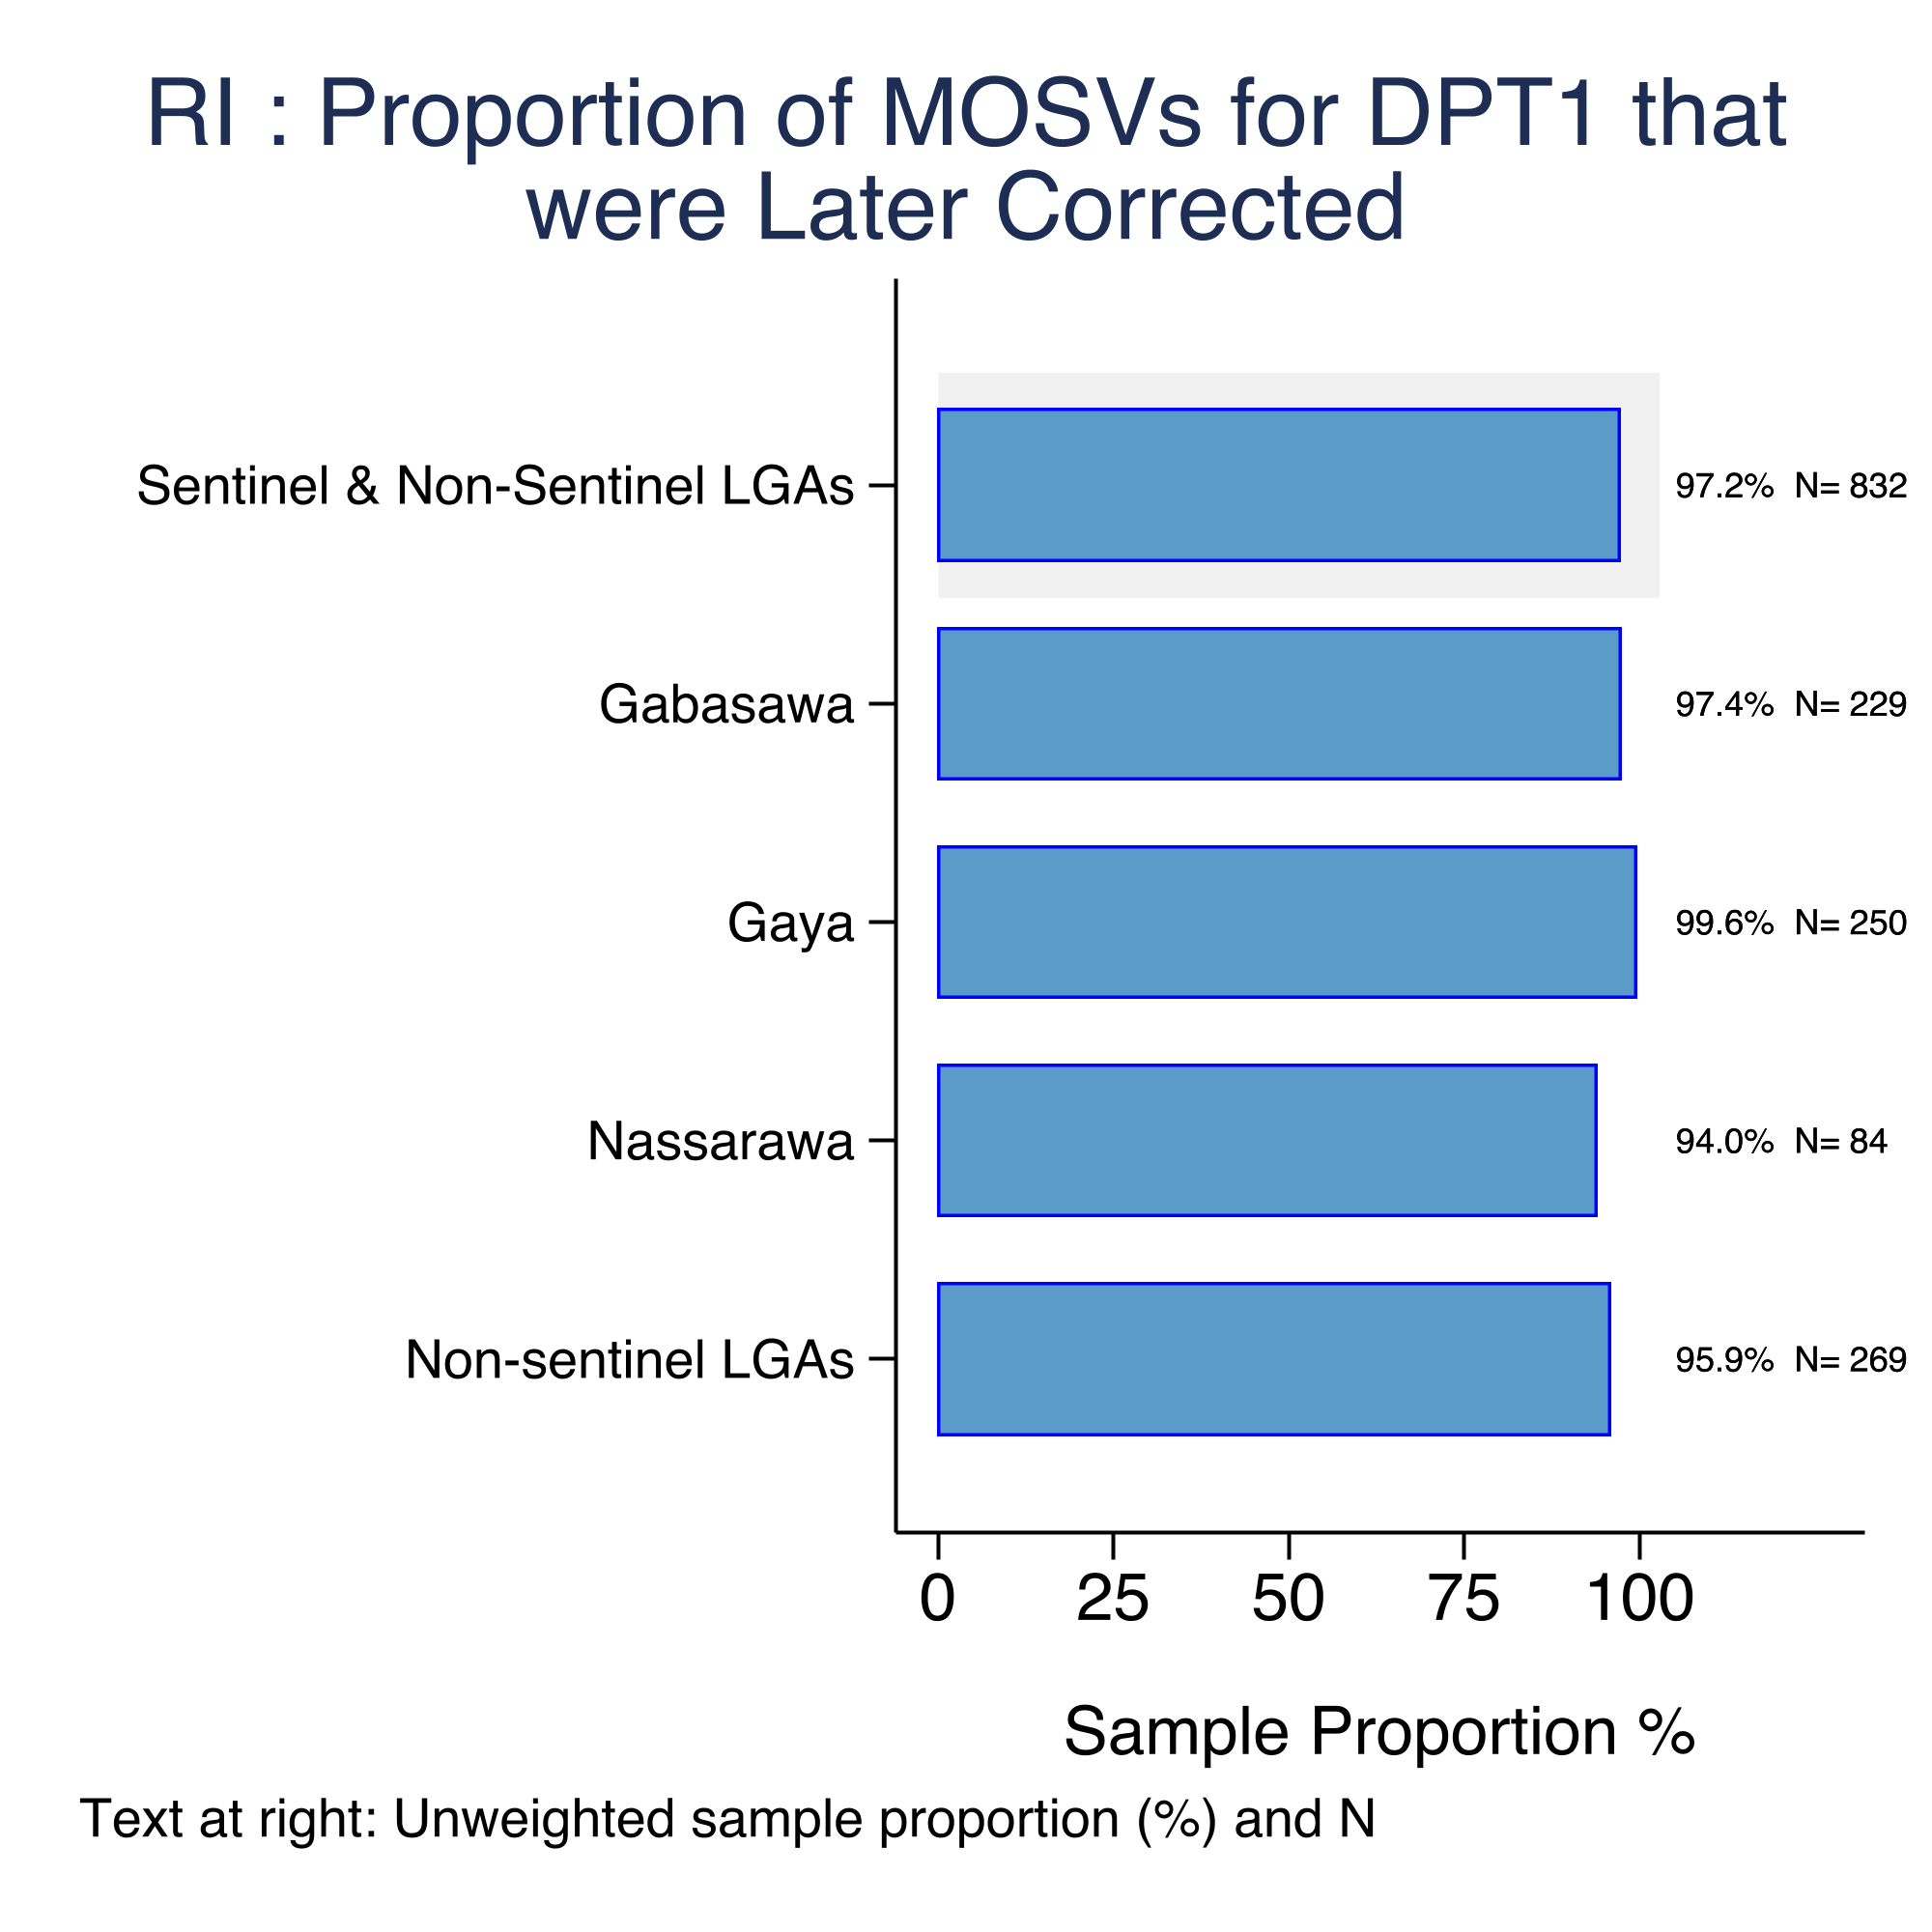
Figure 4.39 shows the estimated valid DPT-1 coverage if there had been no MOSVs and no early doses. The blue bars represent this hypothetical valid coverage, while the gray bars show the actual valid coverage.
Across sentinel and non-sentinel LGAs, the differences between actual and hypothetical coverage are small. Nassarawa shows the highest potential gain, with coverage rising from 53.8% to 56.5% (a gain of 2.7 percentage points). Gabasawa and Gaya show similar small gaps, with potential increases of around 1.9 to 2.1 percentage points. The overall combined estimate for sentinel and non-sentinel LGAs moves only slightly, from 51.4% to 53.2% (a gain of 1.8 percentage points).
These minor differences suggest that MOSVs and early doses have had little impact on DPT-1 coverage in Kano State. In other words, even if the routine immunization system had captured every opportunity to vaccinate at the right time, the increase in valid DPT-1 coverage would have been minimal. Other factors are likely behind the low DPT-1 vaccination rates.
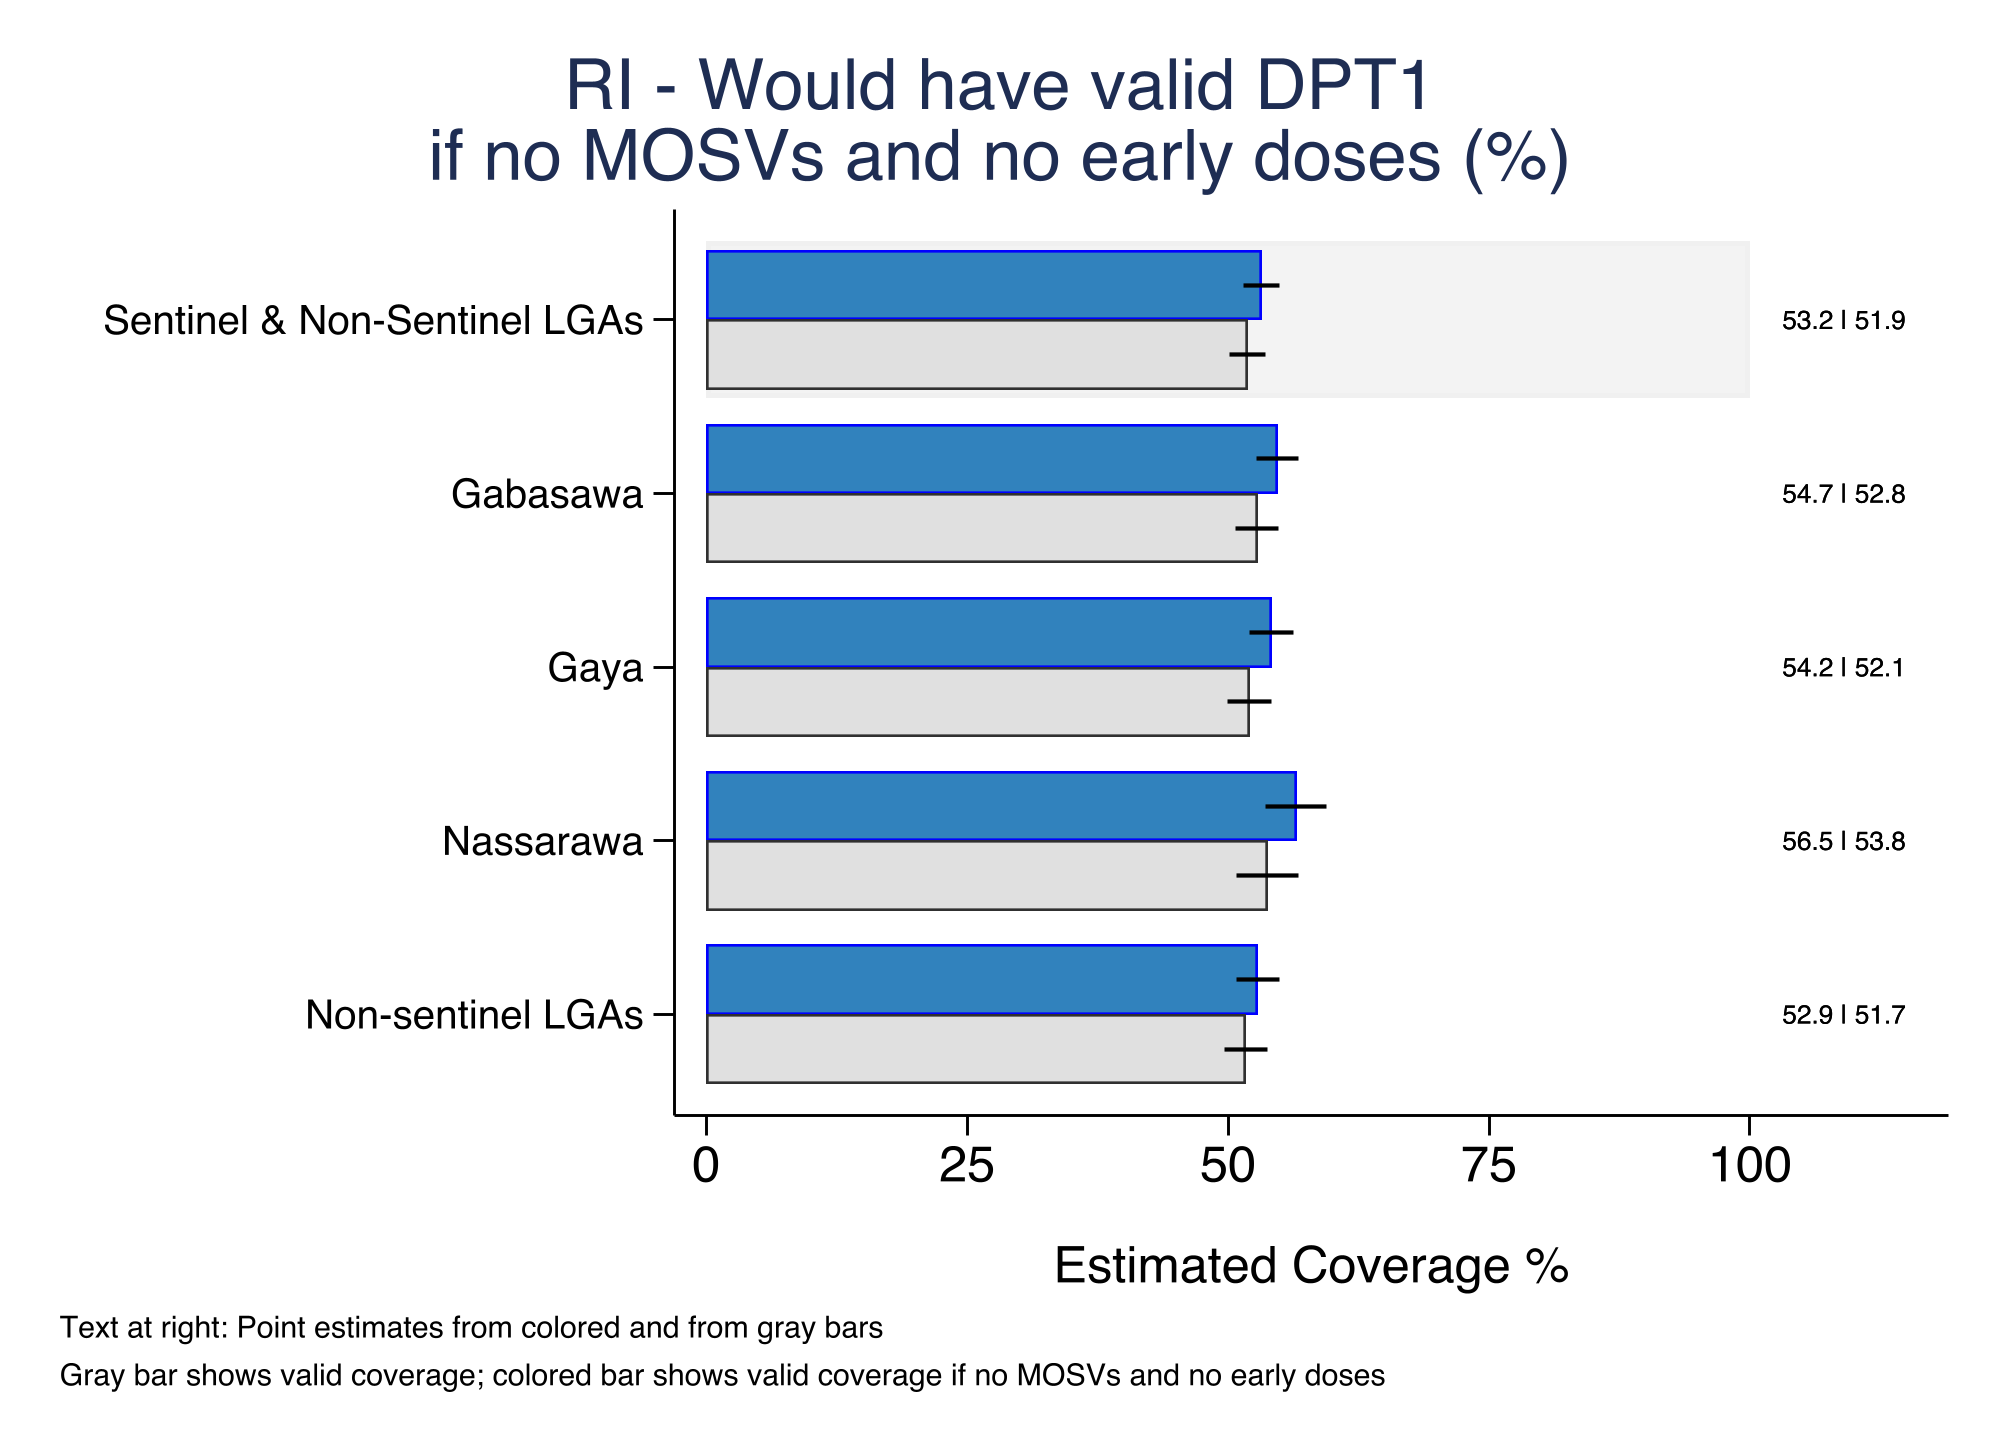
Survey area | No MOSVs | All MOSVs corrected | Mixture of corrected and uncorrected MOSVs | All MOSVs uncorrected |
|---|---|---|---|---|
Gabasawa | 25.9% | 28.4% | 25.1% | 20.6% |
Gaya | 26.4% | 26.7% | 26.0% | 20.8% |
Nassarawa | 20.2% | 17.2% | 33.4% | 29.2% |
Non-sentinel LGAs | 39.3% | 44.1% | 11.0% | 5.6% |
Note: Calculations use crude measures of missed opportunities for simultaneous vaccination (MOSVs). Rows show percentages, calculated using the following doses: BCG, DPT1, DPT2, DPT3, HEPB, IPV1, IPV2, MCV1, MCV2, MENI, OPV0, OPV1, OPV2, OPV3, PCV1, PCV2, PCV3, RV1, RV2, RV3, YF. The table was generated using VCQI's MOSV application, available at https://biostat-global-consulting.shinyapps.io/MOV_Tool_Public/, using routine immunization dataset output by the {vcqiR} library. | ||||
dose | Gabasawa | Gaya | Nassarawa | Non-sentinel LGAs | ||||||||
|---|---|---|---|---|---|---|---|---|---|---|---|---|
Vaccinated at first eligible opportunity | Later corrected MOSV | Uncorrected MOSV | Vaccinated at first eligible opportunity | Later corrected MOSV | Uncorrected MOSV | Vaccinated at first eligible opportunity | Later corrected MOSV | Uncorrected MOSV | Vaccinated at first eligible opportunity | Later corrected MOSV | Uncorrected MOSV | |
BCG | 88.8% | 10.9% | 0.2% | 89.9% | 10.1% | 0.0% | 88.9% | 10.9% | 0.1% | 90.1% | 9.8% | 0.1% |
DPT1 | 82.2% | 17.4% | 0.5% | 78.9% | 21.0% | 0.1% | 84.9% | 14.2% | 0.9% | 83.2% | 16.1% | 0.7% |
DPT2 | 93.1% | 6.7% | 0.2% | 94.1% | 5.9% | 0.0% | 91.9% | 7.8% | 0.4% | 94.2% | 5.5% | 0.3% |
DPT3 | 92.2% | 7.7% | 0.1% | 93.4% | 6.5% | 0.1% | 92.6% | 7.4% | 0.0% | 93.7% | 6.1% | 0.2% |
HEPB | 81.1% | 5.8% | 13.1% | 82.7% | 5.1% | 12.2% | 88.9% | 5.2% | 5.9% | 89.5% | 3.1% | 7.3% |
IPV1 | 63.5% | 32.4% | 4.1% | 59.5% | 30.9% | 9.7% | 68.5% | 29.9% | 1.5% | 76.8% | 21.9% | 1.3% |
IPV2 | 37.2% | 23.1% | 39.7% | 38.2% | 21.7% | 40.1% | 23.2% | 10.2% | 66.6% | 58.9% | 35.9% | 5.2% |
MCV1 | 91.7% | 6.8% | 1.5% | 91.0% | 7.7% | 1.3% | 91.0% | 7.1% | 2.0% | 89.0% | 9.2% | 1.8% |
MCV2 | 97.5% | 2.5% | 0.0% | 98.3% | 1.4% | 0.3% | 98.6% | 1.0% | 0.3% | 97.4% | 2.1% | 0.5% |
MENI | 50.8% | 6.9% | 42.4% | 50.4% | 6.1% | 43.5% | 23.3% | 3.7% | 73.0% | 83.6% | 10.1% | 6.3% |
OPV0 | 86.4% | 5.4% | 8.3% | 88.9% | 4.7% | 6.5% | 90.3% | 4.4% | 5.3% | 92.2% | 3.6% | 4.2% |
OPV1 | 82.4% | 17.1% | 0.4% | 79.3% | 20.6% | 0.1% | 87.5% | 12.1% | 0.4% | 83.4% | 16.0% | 0.6% |
OPV2 | 93.5% | 6.1% | 0.4% | 94.8% | 5.2% | 0.0% | 92.3% | 7.5% | 0.2% | 94.0% | 5.8% | 0.2% |
OPV3 | 90.8% | 7.8% | 1.3% | 91.4% | 8.4% | 0.2% | 90.2% | 9.4% | 0.4% | 91.6% | 7.4% | 1.0% |
PCV1 | 82.2% | 17.3% | 0.5% | 79.0% | 20.9% | 0.2% | 85.1% | 13.3% | 1.6% | 82.9% | 16.5% | 0.7% |
PCV2 | 93.1% | 6.9% | 0.0% | 94.5% | 5.5% | 0.0% | 92.1% | 7.5% | 0.4% | 93.7% | 6.0% | 0.3% |
PCV3 | 93.3% | 6.7% | 0.0% | 93.3% | 6.6% | 0.1% | 93.3% | 6.7% | 0.0% | 93.5% | 6.3% | 0.2% |
RV1 | 82.4% | 16.7% | 1.0% | 80.0% | 18.9% | 1.1% | 85.4% | 12.5% | 2.1% | 84.2% | 15.1% | 0.8% |
RV2 | 92.8% | 7.0% | 0.3% | 92.8% | 6.1% | 1.1% | 93.5% | 6.1% | 0.4% | 93.0% | 6.3% | 0.6% |
RV3 | 88.7% | 6.5% | 4.8% | 89.1% | 6.7% | 4.2% | 90.1% | 6.8% | 3.1% | 90.2% | 6.0% | 3.8% |
YF | 56.8% | 5.5% | 37.7% | 58.2% | 4.8% | 36.9% | 28.0% | 3.7% | 68.3% | 85.6% | 9.3% | 5.1% |
Note: Calculations use crude measures of missed opportunities for simultaneous vaccination (MOSVs). Dose rows show percentages. The table was generated using VCQI's MOSV application, available at https://biostat-global-consulting.shinyapps.io/MOV_Tool_Public/, using routine immunization dataset output by the {vcqiR} library. | ||||||||||||
4.3 Behavioral and Social Drivers of Vaccination
4.3.1 Factors Associated with No/Incomplete Vaccination
4.3.1.1 Regression Analysis of Risk Factors
Mindset estimated a design-based logistic regression for zero-dose status (Penta-1 based) among children aged 6–23 months in the three sentinel LGAs (Gaya, Gabasawa, and Nassarawa). The analysis included 11364 children, after excluding variables with substantial missing data or insufficient variation across responses.
The age range was extended to 6–23 months (rather than the conventional 12–23) to maximise available training data; zero-dose classification is stable across this range and the underlying drivers of non-vaccination are not expected to differ meaningfully between sub-groups.15 The analysis was restricted to sentinel LGAs because survey weights differ substantially between sentinel and non-sentinel areas, which would give non-sentinel observations disproportionate leverage over the model fit.16
The analysis used a forward stepwise variable selection approach based on the design-based AIC metric, applied to survey-weighted logistic regression, with candidate predictors drawn from the full household and caregiver questionnaire.1718
The forward-selection routine retained 7 predictors from the candidate set. In human-interpretable terms, these correspond to:
- vax_importance: The caregiver’s perceived importance of vaccines for the child’s health
- birth_reg: Whether the child’s birth was officially registered
- vax_ease_to_pay: Whether the caregiver finds it easy to afford the costs associated with getting their child vaccinated
- vax_effective: Whether the caregiver believes vaccines are effective
- nn1_zd: Zero-dose status of the nearest neighbouring child in the dataset (excluding siblings from the same household)
- trust_vax_info: Caregiver’s trust in available vaccine information
- community_importance: Perceived importance of vaccines in the caregiver’s community
Two referencing conventions were used for categorical predictors. For scales with an explicit neutral midpoint (e.g., trust in vaccine information), the neutral category was set as the reference so that coefficients capture departures in both positive and negative directions. For monotonic scales without a true neutral point (e.g., perceived importance of vaccination, ease of affording vaccination), the lowest category was set as the reference so that coefficients capture the progressive protective effect of more favourable responses. Binary and demographic predictors use the most common or substantively interpretable category as baseline.
Table 4.73 summarises how each selected predictor was operationalised in the survey data.
# | Name | Variable | Level | n | Mean | SD |
|---|---|---|---|---|---|---|
1 | vax_importance | The caregiver's perceived importance of vaccines for the child's health | Not at all important (ref.) | 598 | 5.3% | 0.223 |
A little important | 780 | 6.9% | 0.253 | |||
Moderately important | 1,748 | 15.4% | 0.361 | |||
Very important | 7,266 | 63.9% | 0.480 | |||
Don't know / Refuse | 972 | 8.6% | 0.280 | |||
2 | birth_reg | Whether the child's birth was officially registered | Registered (ref.) | 4,300 | 37.8% | 0.485 |
Not Registered | 7,064 | 62.2% | 0.485 | |||
3 | vax_ease_to_pay | Whether the caregiver finds it easy to afford the costs associated with getting their child vaccinated | Not at all easy (ref.) | 688 | 6.1% | 0.238 |
A little easy | 1,244 | 10.9% | 0.312 | |||
Moderately easy | 1,570 | 13.8% | 0.345 | |||
Very easy | 6,446 | 56.7% | 0.495 | |||
Don't know / Refuse | 1,416 | 12.5% | 0.330 | |||
4 | vax_effective | Whether the caregiver believes vaccines are effective | Yes (ref.) | 9,698 | 85.3% | 0.354 |
No | 519 | 4.6% | 0.209 | |||
Don't know / Unsure | 1,147 | 10.1% | 0.301 | |||
5 | nn1_zd | Zero-dose status of the nearest neighbouring child (excluding siblings from the same household) | 8,271 | 72.8% | 0.445 | |
Neighbour's household not zero-dose | 3,093 | 27.2% | 0.445 | |||
6 | trust_vax_info | Caregiver's trust in available vaccine information | No trust at all | 311 | 2.7% | 0.163 |
Little trust | 292 | 2.6% | 0.158 | |||
Neutral (ref.) | 866 | 7.6% | 0.265 | |||
Moderate trust | 1,838 | 16.2% | 0.368 | |||
Complete trust | 7,553 | 66.5% | 0.472 | |||
Don't know / Refuse | 504 | 4.4% | 0.206 | |||
7 | community_importance | Perceived importance of vaccines in the caregiver's community | Yes (ref.) | 9,020 | 79.4% | 0.405 |
No | 1,473 | 13.0% | 0.336 | |||
Don't know / Refuse | 871 | 7.7% | 0.266 | |||
Note: "(ref.)" denotes the reference category for each predictor. | ||||||
The tables below show the model selection path and cross-validation performance.
Step | Variable added/removed | AIC | Pseudo-R-squared |
|---|---|---|---|
0 | 14,035.3 | 0.000 | |
1 | + vax_importance | 11,780.0 | 0.255 |
2 | + birth_reg | 10,868.7 | 0.344 |
3 | + vax_ease_to_pay | 10,364.4 | 0.392 |
4 | + vax_effective | 10,118.9 | 0.414 |
5 | + nn1_zd | 9,977.1 | 0.427 |
6 | + trust_vax_info | 9,867.9 | 0.438 |
7 | + community_importance | 9,789.1 | 0.445 |
Holdout Fold | AUCa | Brierb | Accuracyc | Kappad | Squared correlatione | CCCf |
|---|---|---|---|---|---|---|
Fold 1 | 0.84 | 0.138 | 0.81 | 0.505 | 0.368 | 0.538 |
Fold 2 | 0.86 | 0.135 | 0.81 | 0.561 | 0.406 | 0.585 |
Fold 3 | 0.81 | 0.136 | 0.82 | 0.483 | 0.323 | 0.493 |
Fold 4 | 0.82 | 0.149 | 0.80 | 0.499 | 0.340 | 0.511 |
Fold 5 | 0.86 | 0.132 | 0.82 | 0.569 | 0.415 | 0.581 |
All areas | 0.84 | 0.138 | 0.81 | 0.525 | 0.372 | 0.544 |
aArea Under the ROC Curve: summarises the model's ability to rank zero-dose children above vaccinated children across all probability thresholds. Values above 0.8 are considered good discriminative performance. | ||||||
bBrier Score: mean squared error between the model's predicted probability and the actual zero-dose indicator (0 = perfect; 0.25 = uninformative baseline for a balanced binary outcome). Lower is better. | ||||||
cAccuracy: proportion of children correctly classified as zero-dose or vaccinated at a 0.5 probability threshold. | ||||||
dCohen's Kappa: classification accuracy adjusted for chance agreement (0 = no better than chance; 1 = perfect agreement). | ||||||
eSquared correlation: squared Pearson correlation between the model's predicted probabilities and the observed zero-dose indicators (0 to 1; higher means predictions track observations more tightly). | ||||||
fConcordance Correlation Coefficient: measures agreement between predicted probabilities and actual zero-dose status, combining both precision and accuracy of predictions. | ||||||
Model fit was assessed through five-fold cross-validation.19 The model achieved an overall Area Under the Receiver Operating Characteristic Curve (AUC-ROC) of 0.84, which is considered reasonably good discriminative performance, and a cross-validated squared correlation of 0.372 between predicted probabilities and observed zero-dose indicators.20
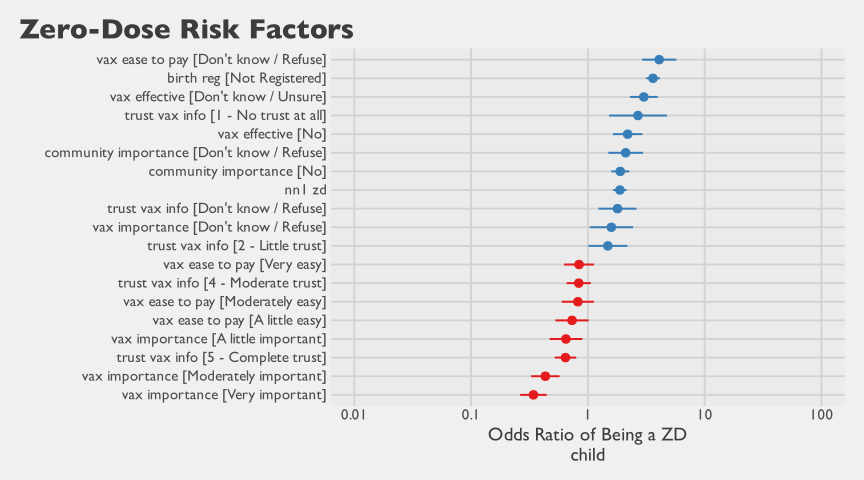
Figure 4.40 plots the odds ratios for the final selected risk factors. Children whose birth was not registered have substantially elevated odds of being zero-dose — corresponding to an average predicted probability of 38% compared with 20% for children with registered births — as do children of caregivers who do not consider vaccines important. Other predictors — including place of delivery, household size, internet use, and nearest-neighbor zero-dose status (the binary vaccination status of the geographically closest child in the dataset, excluding any siblings from the same household; its selection is unsurprising and confirms that zero-dose status clusters geographically) — show more modest but directionally consistent associations. Variables whose confidence intervals cross one should be interpreted cautiously, as their estimated effects are statistically consistent with no association.
Two risk factors stand out as by far the dominant predictors: birth registration and caregiver belief in vaccine importance. Their prominence is substantively interesting, and each deserves closer examination.
Birth registration is, on its face, an administrative act — yet it emerges as one of the strongest predictors of zero-dose status in this analysis. Part of the association may reflect a convenience pathway: families who deliver in a health facility are in a setting where birth registration and vaccination can often happen together — or at least where both services are physically accessible at the same time and place. The co-location of services reduces the logistical barriers to both, creating a logical dependence between access to registration and access to early vaccination doses. Beyond this, the association likely also reflects a deeper latent construct: families who navigate civil registration processes tend to be the same families who engage more broadly with government services and the formal healthcare system. Registering a birth requires interacting with government offices, implies a degree of trust in — or at least willingness to engage with — state institutions, and reflects a pattern of health-seeking and administrative participation that predisposes households to seek routine immunization. In this sense, birth registration acts as a proxy for social and institutional integration, a characteristic that shapes access to and uptake of a wide range of public services. It would be interesting for future research to examine whether programmes that integrate birth registration and vaccination services — or that use registration records to identify and follow up unvaccinated children — could yield meaningful gains in coverage.
Caregiver belief in vaccine importance similarly points in a demand-side direction. Critically, earlier findings in this report show that many zero-dose children do not have caregivers who actively oppose vaccination; rather, caregivers frequently report uncertain or ambivalent beliefs about vaccine safety and benefits. In this context, the strong association with perceived importance suggests that the barrier for many families is not ideological rejection but motivational indifference — vaccines are simply not seen as sufficiently important or urgent to act on. The gradient in predicted risk is substantial: caregivers who consider vaccines not at all important have an estimated 45% probability of having a zero-dose child, compared with 28% among those who consider vaccines very important. This distinction matters for programme design. Interventions aimed primarily at countering anti-vaccine sentiment may be less effective in this context than approaches that raise the salience and perceived necessity of vaccination — for example, community-level social norms messaging, household visits by trusted community health workers, or the integration of vaccination counselling into birth registration touchpoints where caregiver attention is already high.
4.3.2 Perceptions of Vaccination
4.3.2.1 Knowledge, Awareness, and Perceptions
Despite high rates of zero-dose prevalence, most children have caregivers who believe vaccines are important for their child’s health, regardless of location. As shown in Figure 4.42, a large majority (ranging from an estimated 65% to 72% across different survey areas) of children has caregivers who rated vaccines as “very important.”
This view is consistent across each sentinel and non-sentinel LGA. Nassarawa records the highest positive rates, with an estimated 72% of children having caregivers who rated vaccines as “very important,” and more than one in ten rating them as at least “a little important”.
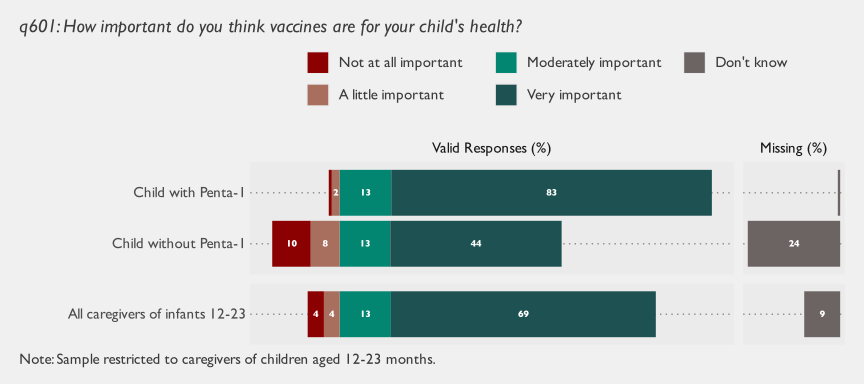
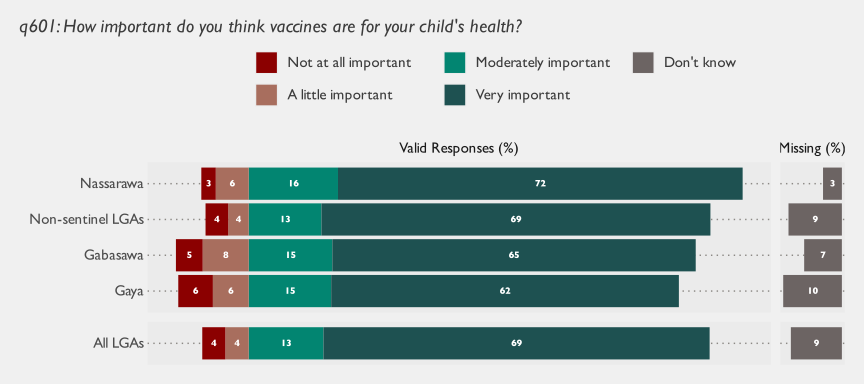
A child’s vaccination status is strongly associated to caregivers’ views on vaccine importance \((F_{(3, 496)}=105.8\), \(p<.001)\), safety \((F_{(2, 497)}=216.1\), \(p<.001)\) and benefits \((F_{(1, 498)}=147.1\), \(p<.001)\), but show no significant variation across LGAs.
Notably, an estimated 96% of children vaccinated with Penta-1 has caregivers who see vaccines as “moderately” or “very important,” compared to 57% of zero-dose children (Figure 4.41 shows).
Interestingly, roughly one-third of zero-dose children have caregivers who, rather than being convinced that vaccines are unsafe (Figure 4.43) or have no benefits (Figure 4.45), report uncertain opinions regarding vaccine safety and benefits.
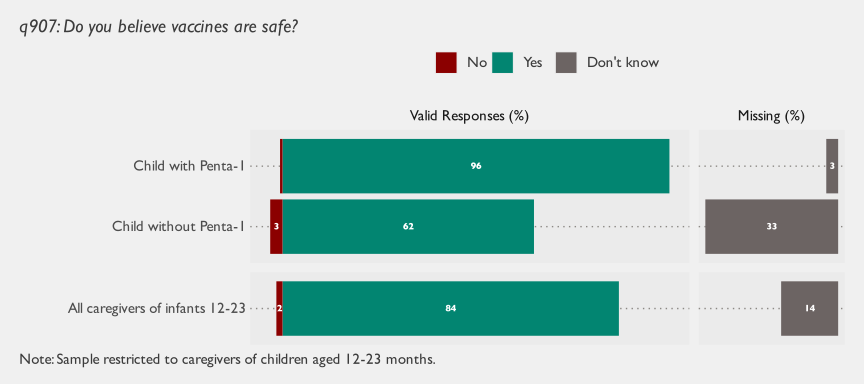
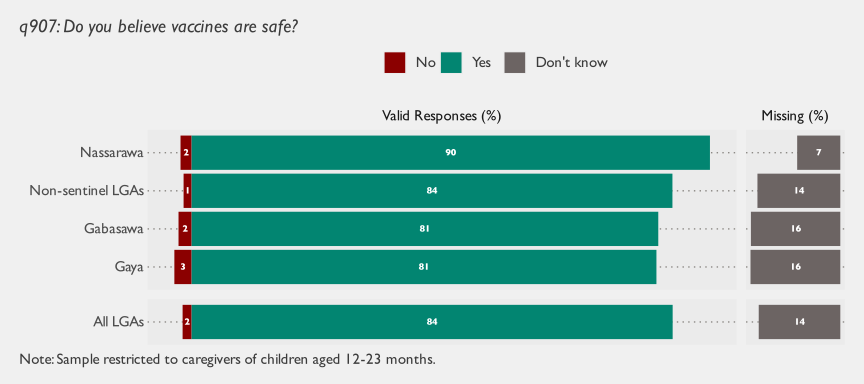
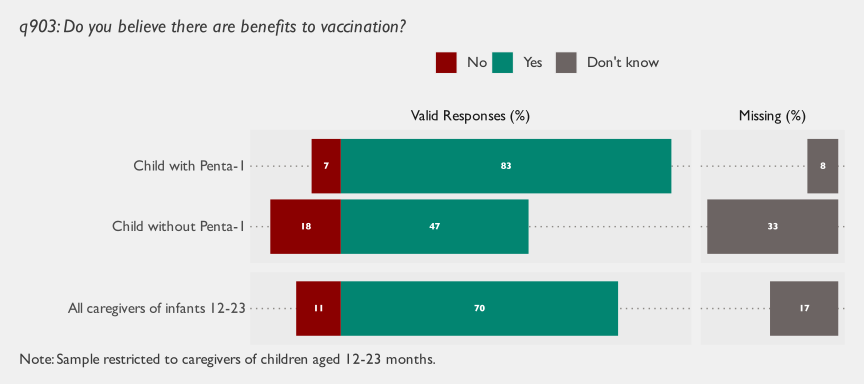
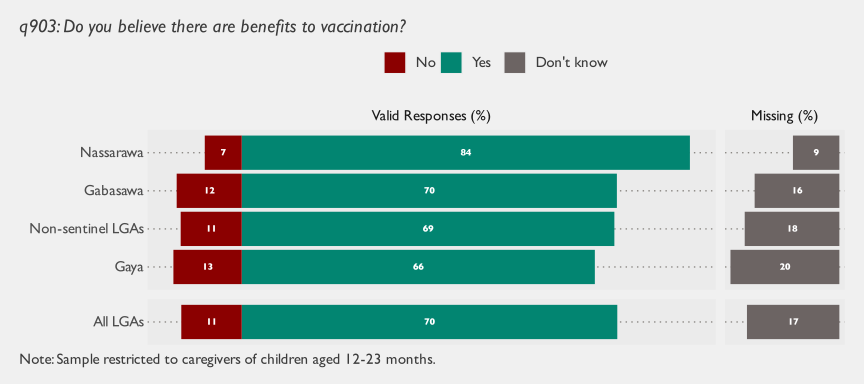
Caregivers’ beliefs and decisions about vaccines are shaped not only by their own knowledge and experiences, but also by their social environment. As shown in Figure 4.47, most children who received Penta-1 (92%) have caregivers who feel that people important to them approve of vaccination, compared to only 56% of zero-dose children \((F_{(1, 498)}=147.1\), \(p<.001)\).
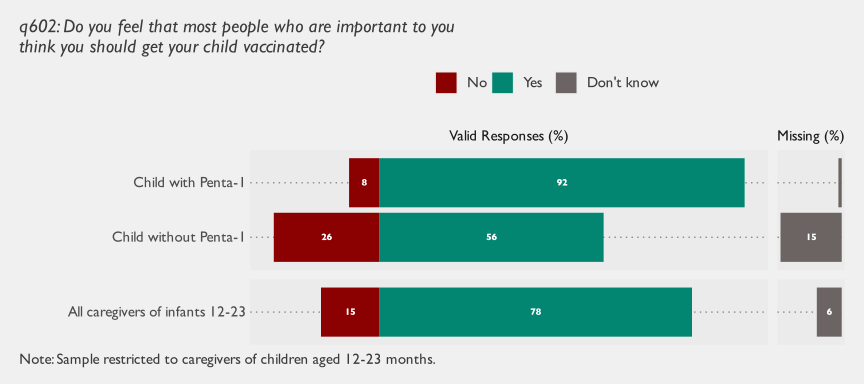
Across LGAs, about a third of children have caregivers who say someone in their family, community, or social network encouraged them to vaccinate their child, with the highest proportions recorded in Nassarawa and Gaya (35%) (Figure 4.48). Very few report they have been advised not to vaccinate their child. However, most children—around 60%—have caregivers who do not perceive any influence from others on their decision.
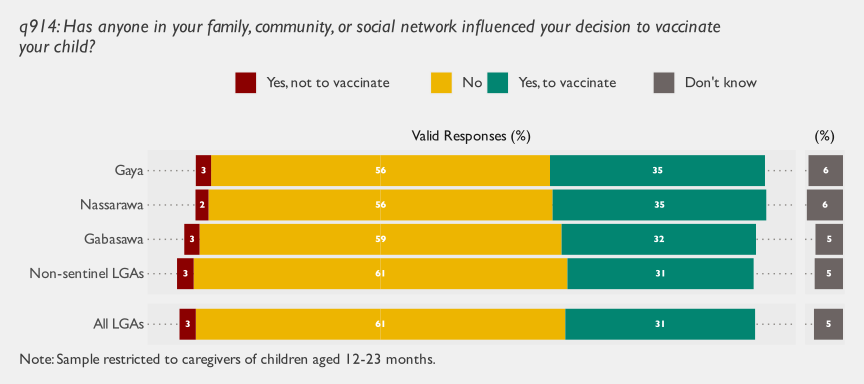
More than 60% of children have caregivers who report no external source of influence on their vaccination decision. However, when caregivers do report such influence, it most often comes from friends and family (Figure 4.49). Health workers and religious or community leaders also appear to play a role, but to a lesser extent.
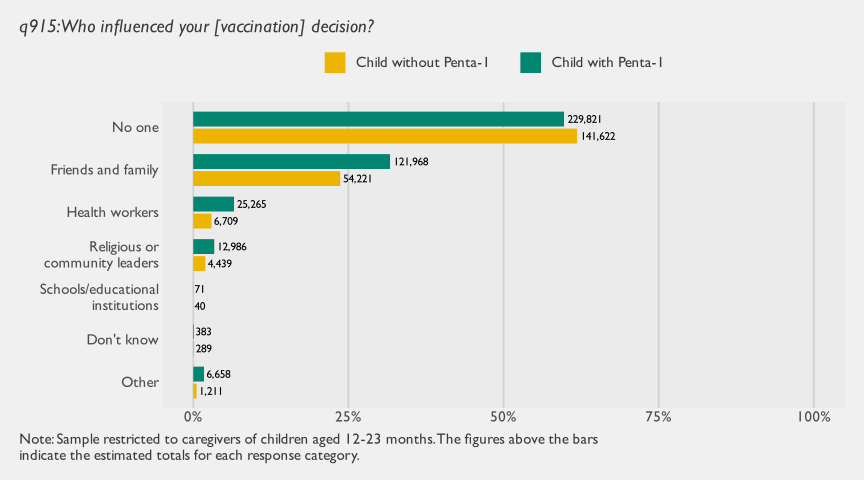
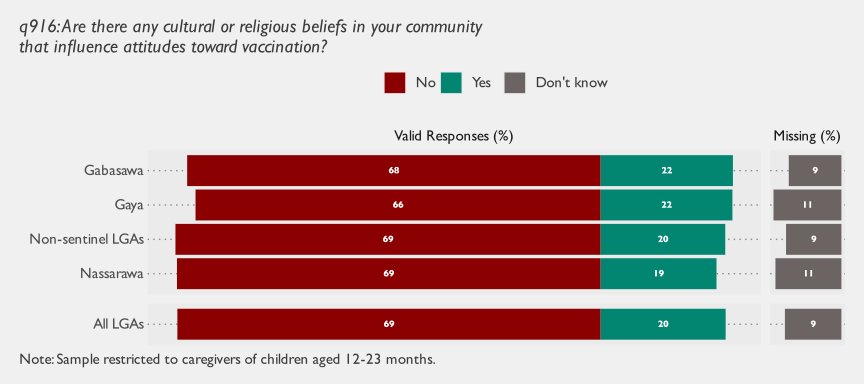
As shown in Figure 4.51, about one in five caregivers report that cultural and religious beliefs in their community influence views on vaccination. This pattern is consistent across LGAs, with Gaya and Gabasawa displaying a slightly higher share of positive answers (22%).
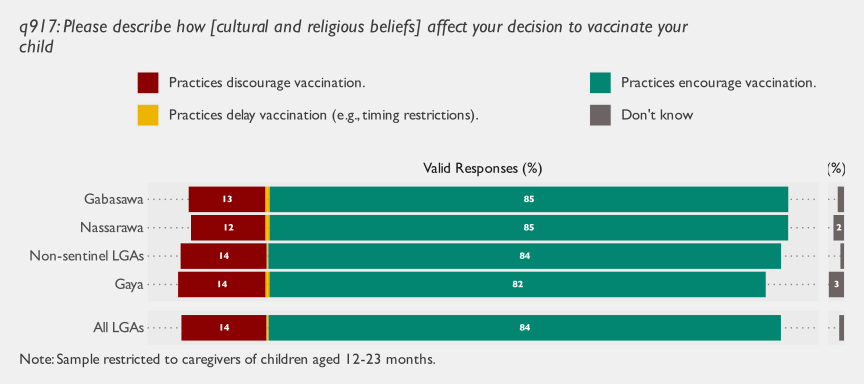
4.3.2.2 Trust in Vaccination
While trust in the healthcare system is generally high, Figure 4.52 reveals important gaps between caregivers of zero-dose vis à vis immunized children. In fact, more than one out of ten penta-unvaccinated children has parents who report little or no trust in the system, compared to less than 1% of vaccinated children.
Similar patterns emerge in relation to trust in healthcare workers and vaccine information. Across LGAs, 14% of zero-dose children have caregivers with little or no trust in the information they receive about vaccines, compared to about 4% of immunized children (Figure 4.55). Similarly, 12% of zero-dose children have caregivers with little or no trust in healthcare workers’ ability to provide accurate and reliable care, compared to less than 1% of vaccinated infants (Figure 4.57).
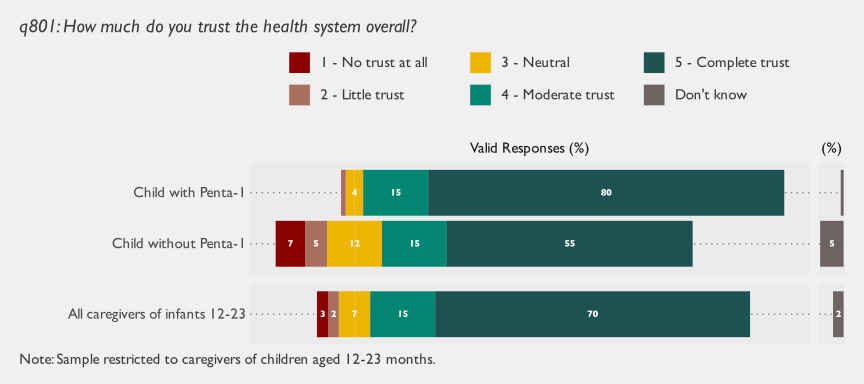
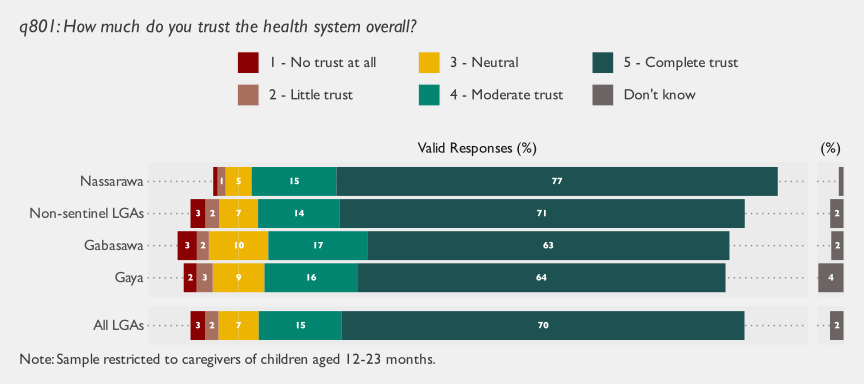
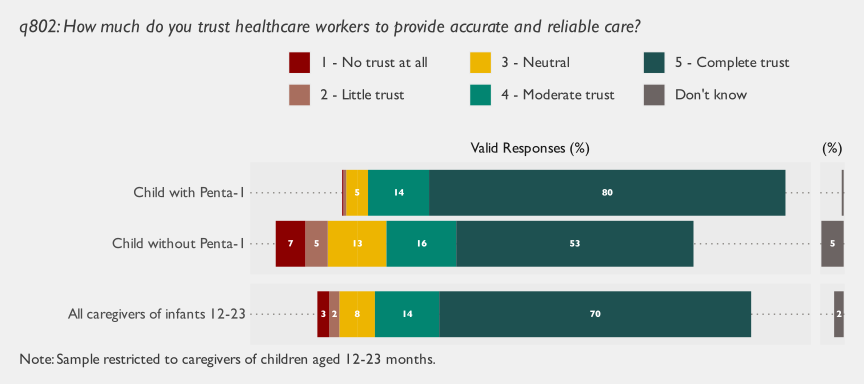
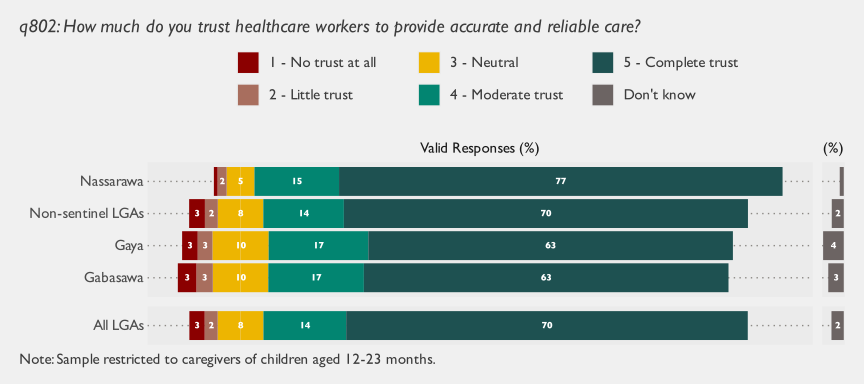
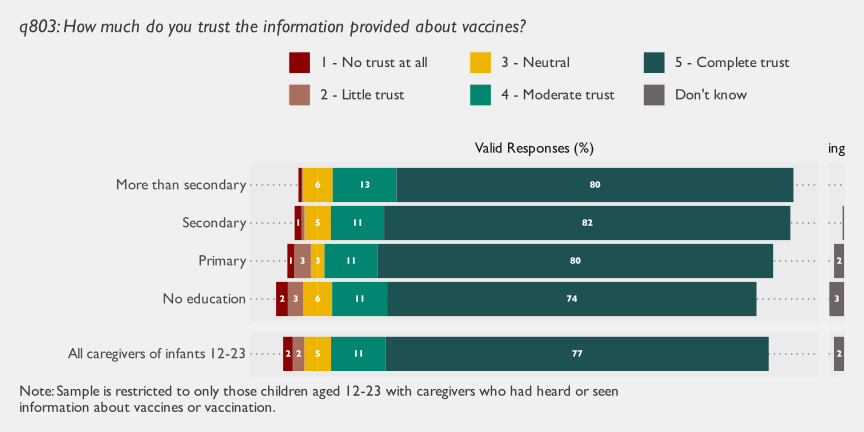
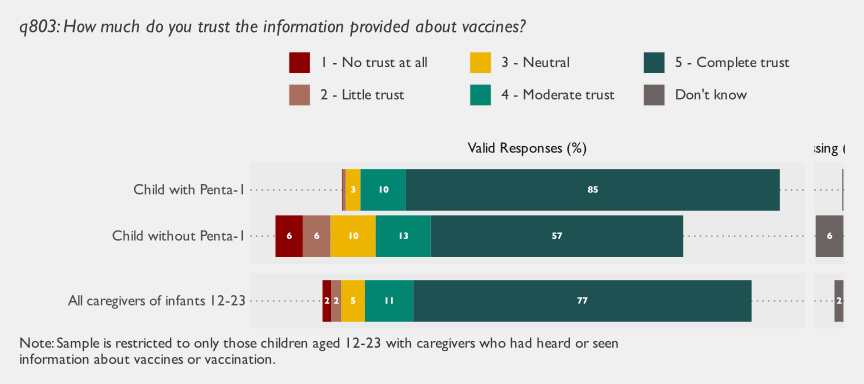
4.3.2.3 Behavioral and Social Drivers
The survey asked caregivers why their child had not received certain vaccines, or why the child had not received any vaccines at all. Respondents could select multiple reasons based on categories defined in the WHO’s Behavioral and Social Drivers (BeSD) framework (WHO and UNICEF 2022), which groups drivers under the four domains of access, health facility, beliefs, and social processes.
Figure 4.58 shows the responses given by caregivers of truly zero-dose children, and Table 4.78 presents the same information along with more detailed statistics.
Proportion | MOE (Prop) | 95% CI | LCB | UCB | DEFF | Estimated Total | MOE (Total) | Unweighted Cases | |
|---|---|---|---|---|---|---|---|---|---|
Social processes | 41.3% | ±3.5 | (37.8; 44.8) | 38.3% | 44.3% | 8.06 | 140,551 | ±18,948 | 2,337 |
Beliefs | 23.1% | ±3.5 | (19.8; 26.8) | 20.3% | 26.2% | 10.75 | 78,721 | ±12,812 | 1,497 |
Access | 14.9% | ±1.9 | (13.1; 17.0) | 13.4% | 16.6% | 4.67 | 50,787 | ±7,041 | 1,007 |
Health center | 4.6% | ±1.1 | (3.7; 5.8) | 3.8% | 5.6% | 4.08 | 15,779 | ±3,483 | 304 |
Abbreviations: CI = Confidence Interval; MOE = Margin of Error; LCB = Lower Confidence Bound; UCB = Upper Confidence Bound; DEFF = Design Effect; Domain sample size = 6,041; Note: Because answers follow a select-multiple format, proportions in this table do not necessarily sum to 100% | |||||||||
Note: Categories are based on existing BeSD of vaccination tools and guidance (see WHO, 2022). | |||||||||
Proportion | MOE (Prop) | 95% CI | LCB | UCB | DEFF | Estimated Total | MOE (Total) | Unweighted Cases | |
|---|---|---|---|---|---|---|---|---|---|
Intent | 59.0% | ±3.7 | (55.3; 62.6) | 55.9% | 62.0% | 8.76 | 200,860 | ±19,827 | 3,417 |
Access | 10.1% | ±1.5 | (8.7; 11.7) | 8.9% | 11.4% | 3.86 | 34,381 | ±5,404 | 678 |
Service delivery | 4.5% | ±1.0 | (3.6; 5.6) | 3.8% | 5.4% | 3.54 | 15,394 | ±3,172 | 357 |
Abbreviations: CI = Confidence Interval; MOE = Margin of Error; LCB = Lower Confidence Bound; UCB = Upper Confidence Bound; DEFF = Design Effect; Domain sample size = 6,041; Note: Because answers follow a select-multiple format, proportions in this table do not necessarily sum to 100% | |||||||||
Note: Categories are based on the mapping of BeSD of vaccination (WHO, 2022), used in the original survey instrument, to the EGH Vaccine Delivery Framework domains (see Carter et al., 2020). | |||||||||
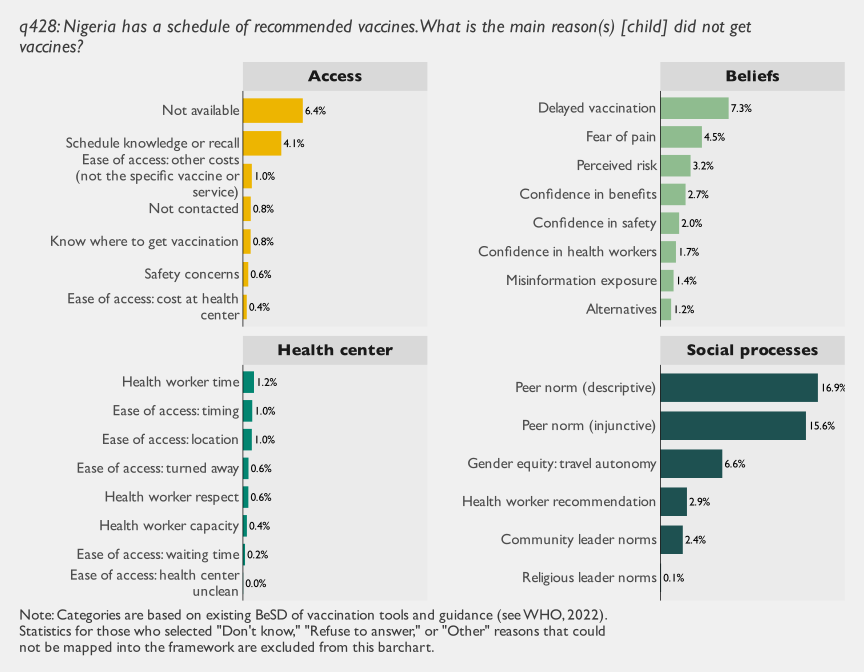
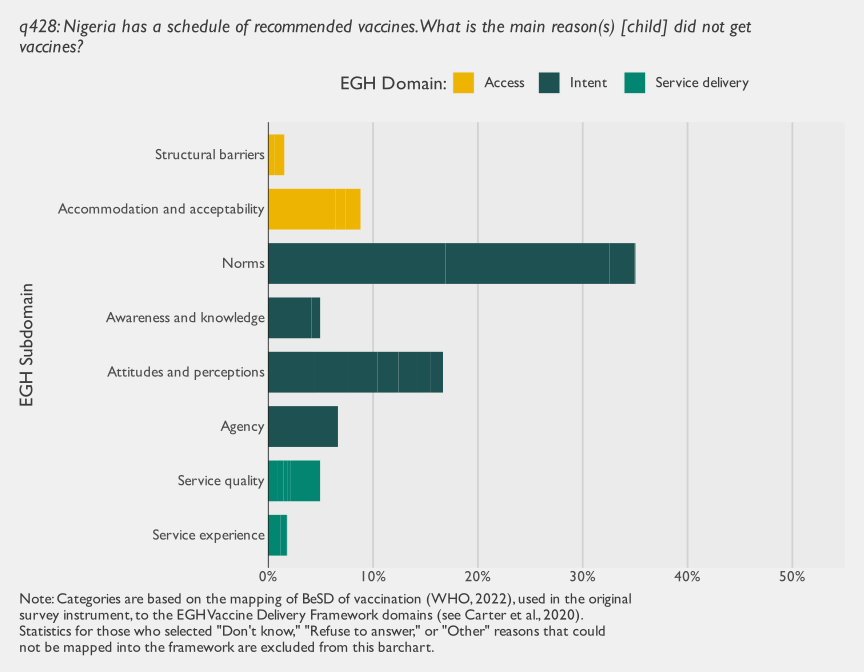
The most cited reasons relates to social norms: about 41% of children had caregivers who cited at least one social norm (Table 4.76). More specifically, 16.9% of truly-zero-dose children had caregivers who cited descriptive peer norms (i.e., family or friends do not get vaccinated—themselves or their children), and 15.6% had caregivers who pointed to injunctive peer norms (i.e., family of friends do not support vaccination), while community and religious leader norms were cited less often (2.4% and less than 1%, respectively).
Given the evidence reviewed in Section 4.3.2.1, it remains unclear why many caregivers believe family and friends disapprove of vaccination. In fact, the vast majority of children had caregivers who reported cultural and religious beliefs as supportive of vaccination (Figure 4.51), that most felt people important to them think they should vaccinate their child (Figure 4.47), and that the influence they received from family, community, or social networks encourage vaccination (Figure 4.49).
Reasons related to beliefs (23.1%), access (14.9%), or the health facility (4.6%) were mentioned less often (Table 4.76). Regarding access barriers, 6.4% of children had caregivers who said vaccines were not available (e.g., because they were busy, away from home, or the child was sick), and 4.1% had caregivers who mentioned forgetting or not knowing the national immunization schedule. Belief-related reasons—such as fear of pain (4.4%), perceived risk of disease (3.2%), or lack of confidence in vaccine benefits (2.7%)—were also cited by a minority. Finally, health facility issues such as long waiting times, inconvenient opening hours, or being turned away were rarely mentioned.
It is important to note that these figures appear small because of the multiple-choice structure of the underlying survey question. Nevertheless, they suggest that social processes—particularly what is seen as normal or acceptable in a caregiver’s network—are closely associated with child’s zero-dose status, more so than logistical barriers or individual beliefs.
Proportion | MOE (Prop) | 95% CI | LCB | UCB | DEFF | Estimated Total | MOE (Total) | Unweighted Cases | |
|---|---|---|---|---|---|---|---|---|---|
Family or friends don’t get vaccinated (themselves or their children) | 16.9% | ±2.1 | (14.9; 19.2) | 15.2% | 18.8% | 5.06 | 57,589 | ±8,400 | 932 |
Family or friends don’t support vaccination | 15.6% | ±2.0 | (13.7; 17.7) | 14.0% | 17.4% | 4.71 | 53,221 | ±8,288 | 835 |
Decided to delay vaccination | 7.3% | ±2.8 | (5.0; 10.6) | 5.3% | 10.0% | 17.82 | 24,964 | ±9,460 | 427 |
Needed permission to take child for vaccination | 6.6% | ±2.4 | (4.6; 9.5) | 4.9% | 9.0% | 14.60 | 22,641 | ±9,644 | 420 |
Not available to get vaccinated (busy, away from home, or child was sick) | 6.4% | ±1.2 | (5.4; 7.7) | 5.5% | 7.5% | 3.46 | 21,906 | ±4,042 | 408 |
Pain or distress from injection | 4.5% | ±1.0 | (3.6; 5.5) | 3.7% | 5.3% | 3.36 | 15,187 | ±3,428 | 288 |
Didn’t know or forgot when due for vaccination | 4.1% | ±1.1 | (3.2; 5.4) | 3.3% | 5.1% | 4.66 | 14,035 | ±3,689 | 247 |
Not concerned about the disease(s) that the vaccine prevents | 3.2% | ±1.2 | (2.3; 4.6) | 2.4% | 4.4% | 6.83 | 11,059 | ±4,013 | 215 |
Health worker didn’t recommend vaccination | 2.9% | ±1.0 | (2.0; 4.0) | 2.1% | 3.8% | 5.31 | 9,718 | ±3,535 | 142 |
Vaccine not important / needed / effective | 2.7% | ±0.6 | (2.2; 3.4) | 2.3% | 3.3% | 2.09 | 9,217 | ±2,074 | 236 |
Community leaders don’t support vaccination | 2.4% | ±0.7 | (1.8; 3.3) | 1.9% | 3.1% | 3.51 | 8,198 | ±2,536 | 137 |
Vaccine not safe / concerned about side effects | 2.0% | ±0.7 | (1.4; 2.8) | 1.5% | 2.7% | 3.68 | 6,860 | ±2,361 | 123 |
Don’t trust health workers who give vaccines | 1.7% | ±0.6 | (1.2; 2.4) | 1.2% | 2.2% | 3.30 | 5,699 | ±2,059 | 107 |
Heard rumours or something bad about vaccines | 1.4% | ±0.7 | (0.9; 2.3) | 1.0% | 2.1% | 4.94 | 4,828 | ±2,262 | 78 |
Health workers do not spend enough time with people | 1.2% | ±0.5 | (0.8; 1.8) | 0.9% | 1.7% | 2.94 | 4,049 | ±1,592 | 68 |
Prefer traditional or alternative approaches | 1.2% | ±0.5 | (0.7; 1.8) | 0.8% | 1.7% | 3.86 | 3,938 | ±1,794 | 107 |
Health center has inconvenient opening times | 1.0% | ±0.5 | (0.6; 1.7) | 0.6% | 1.6% | 4.56 | 3,411 | ±1,789 | 57 |
Could not afford other costs related to vaccination (e.g., transport to health center, taking time away from work, childcare, recovery time) | 1.0% | ±0.5 | (0.6; 1.6) | 0.6% | 1.5% | 4.28 | 3,264 | ±1,821 | 59 |
Health center is hard to get to | 1.0% | ±0.4 | (0.6; 1.4) | 0.7% | 1.3% | 2.41 | 3,260 | ±1,269 | 85 |
His Age not eligible to that vaccine | 0.9% | ±0.4 | (0.6; 1.4) | 0.6% | 1.3% | 2.80 | 3,080 | ±1,280 | 79 |
Not contacted about being due for vaccination | 0.8% | ±0.3 | (0.6; 1.2) | 0.6% | 1.2% | 2.00 | 2,868 | ±1,072 | 97 |
Didn’t know where to go for vaccination | 0.8% | ±0.3 | (0.6; 1.2) | 0.6% | 1.1% | 1.55 | 2,823 | ±956 | 83 |
Health center turns people away (vaccines not available, session cancelled) | 0.6% | ±0.3 | (0.4; 1.0) | 0.4% | 0.9% | 2.66 | 2,056 | ±1,052 | 41 |
Health workers were not respectful | 0.6% | ±0.3 | (0.3; 1.0) | 0.4% | 0.9% | 3.03 | 1,989 | ±1,153 | 31 |
Unsafe to travel to the vaccination site (may be due to weather, crime, conflict, or disaster) | 0.6% | ±0.4 | (0.3; 1.1) | 0.3% | 1.0% | 3.48 | 1,951 | ±1,196 | 31 |
Health workers were missing skills | 0.4% | ±0.3 | (0.2; 0.9) | 0.2% | 0.8% | 3.78 | 1,454 | ±1,072 | 12 |
Could not afford the cost at the health center (e.g., payment for services) | 0.4% | ±0.3 | (0.2; 0.8) | 0.2% | 0.7% | 2.81 | 1,405 | ±948 | 31 |
Health center has long waiting times | 0.2% | ±0.2 | (0.1; 0.6) | 0.1% | 0.5% | 3.92 | 769 | ±800 | 24 |
Religious leaders don’t support vaccination | 0.1% | ±0.1 | (0.0; 0.2) | 0.0% | 0.1% | 0.64 | 263 | ±186 | 18 |
Health center is not clean | 0.0% | ±0.0 | (0.0; 0.1) | 0.0% | 0.1% | 0.24 | 101 | ±72 | 8 |
Don't know | 11.5% | ±2.6 | (9.2; 14.4) | 9.5% | 13.9% | 10.61 | 39,264 | ±11,596 | 696 |
Abbreviations: CI = Confidence Interval; MOE = Margin of Error; LCB = Lower Confidence Bound; UCB = Upper Confidence Bound; DEFF = Design Effect; Domain sample size = 6,041; Note: Because answers follow a select-multiple format, proportions in this table do not necessarily sum to 100% | |||||||||
Note: Categories are based on existing behavioural and social drivers (BeSD) of vaccination tools and guidance. See WHO (2022). | |||||||||
Interestingly, 11.5% of truly-zero-dose children had caregivers who either did not know (11.5%) or refused to answer the question (4.3%) when asked why their child had received no vaccines (Table 4.78). For many caregivers, the reasons behind non-vaccination may be unclear even to themselves, difficult to articulate, or sensitive to disclose.
This type of answers could reflect genuine uncertainty, especially if decisions around vaccination are shaped by multiple overlapping factors that caregivers find hard to disentangle. They could also point to discomfort in openly sharing reasons that could be seen as socially undesirable (for example, if the respondent assumes the researchers support vaccination).
Although the questionnaire options were based on the WHO BeSD framework, each BeSD domain and subdomain was later mapped onto the Exemplars in Global Health (EGH) Exemplars in Vaccine Delivery Framework (Carter et al. 2020). The EGH Framework, informed by the work of LaFond et al. (2015) and Phillips et al. (2017), was developed to understand how exemplar countries achieve high vaccine coverage (Bednarczyk et al. 2022). It groups barriers into three domains—intent, access, and service delivery—each with related subdomains.
The mapping results show that most common barriers fall within the “intent” domain, especially in the subdomains of (social)norms and attitudes and perceptions (Figure 4.59). Nearly six in ten (59%) caregivers of truly zero-dose children reported at least one reason in the “intent” domain (Table 4.77).
4.3.3 Access to Healthcare and Service Environment
4.3.3.1 Physical Access
As shown in Figure 4.60, for most children—across all survey areas—the nearest health facility is within 1-5 km of their household. Nassarawa stands out, with more than half of children having a facility within one km, likely reflecting its urban setting. In contrast, in Gaya and Gabasawa, only around 40% of children have a health facility within that distance, and in non-sentinel LGAs, the figure is even lower, at 29%. This figure considers any healthcare facility, regardless of whether immunization services are offered.
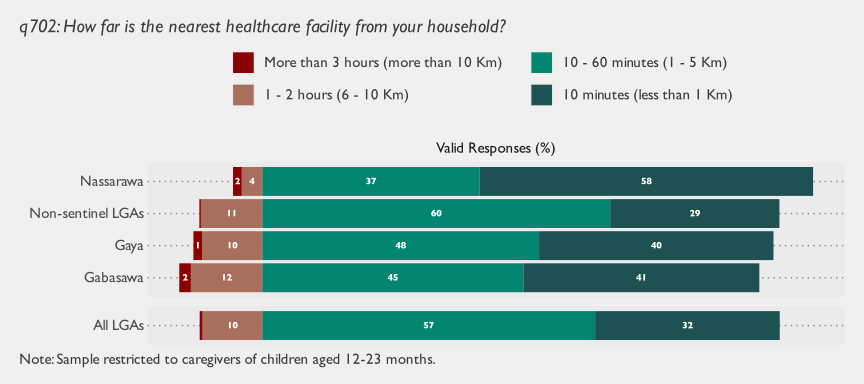
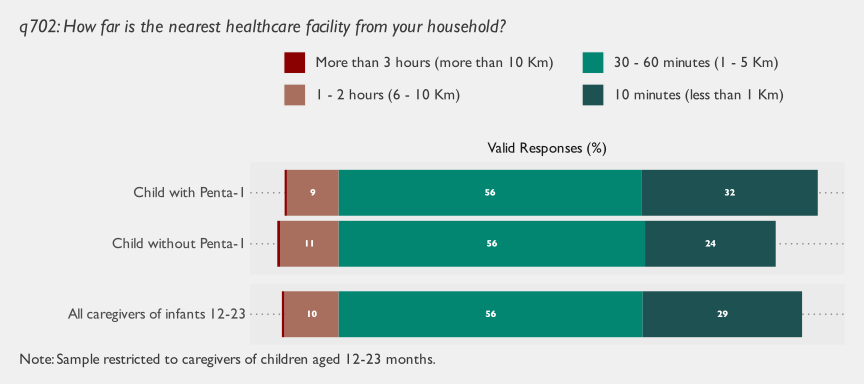
Survey area | Zero-dose status (household) | 10 minutes | 10-60 minutes | 1-2 hours | More than 3 hours | ||||
|---|---|---|---|---|---|---|---|---|---|
% | Est. total | % | Est. total | % | Est. total | % | Est. total | ||
Gabasawa | Non-zero-dose household | 38.9% | 8,061 | 46.5% | 9,642 | 12.9% | 2,674 | 1.7% | 354 |
Zero-dose household | 37.5% | 2,896 | 48.0% | 3,709 | 11.8% | 910 | 2.7% | 207 | |
All households with children 12-23 | 38.5% | 10,957 | 46.9% | 13,351 | 12.6% | 3,583 | 2.0% | 560 | |
Gaya | Non-zero-dose household | 44.7% | 8,775 | 45.4% | 8,907 | 9.2% | 1,811 | 0.6% | 127 |
Zero-dose household | 31.8% | 3,061 | 51.9% | 4,995 | 14.1% | 1,354 | 2.2% | 210 | |
All households with children 12-23 | 40.5% | 11,835 | 47.5% | 13,901 | 10.8% | 3,165 | 1.2% | 337 | |
Nassarawa | Non-zero-dose household | 57.6% | 13,703 | 37.1% | 8,830 | 3.5% | 844 | 1.8% | 428 |
Zero-dose household | 47.6% | 1,934 | 47.3% | 1,924 | 3.3% | 134 | 1.8% | 74 | |
All households with children 12-23 | 56.1% | 15,637 | 38.6% | 10,755 | 3.5% | 979 | 1.8% | 502 | |
Non-sentinel LGAs | Non-zero-dose household | 29.7% | 96,987 | 60.0% | 196,279 | 10.0% | 32,751 | 0.3% | 1,046 |
Zero-dose household | 23.2% | 27,090 | 64.3% | 75,026 | 12.5% | 14,558 | 0.1% | 96 | |
All households with children 12-23 | 28.0% | 124,077 | 61.1% | 271,305 | 10.7% | 47,309 | 0.3% | 1,142 | |
All LGAs | Non-zero-dose household | 32.6% | 127,526 | 57.2% | 223,658 | 9.7% | 38,080 | 0.5% | 1,954 |
Zero-dose household | 25.3% | 34,980 | 62.0% | 85,653 | 12.3% | 16,956 | 0.4% | 587 | |
All households with children 12-23 | 30.7% | 162,506 | 58.4% | 309,311 | 10.4% | 55,036 | 0.5% | 2,541 | |
Note: Sample restricted to caregivers of children aged 12-23 months. The term "zero-dose household" refers to a household where at least one age-eligible child has not received a Penta-1 vaccine. These results should be interpreted with caution, as the original question combined time and distance units, skipped intermediate intervals (e.g., 2-3 hours), and the response wording was changed partway through fieldwork. | |||||||||
This information can also be visualized on a map. There are several ways this could be done, but the plots below model the probability that caregivers self-report being within 10 minutes (or 1km) of a healthcare facility.
The majority rely on walking to reach the nearest healthcare facility, with an estimated 57.3% reporting this as their primary mode of transport (Figure 4.65). This is followed by 23.4% who use motorcycles, and smaller shares who rely on public transportation (9%) or three-wheelers (7.2%). Use of bicycles (2%) and private cars (less than 1%) is rare.
These figures suggest that traveling to a health facility for vaccination may involve considerable time or physical effort. In fact, 42% of caregivers that need to travel between 6-10 km and 33% of caregivers that need to travel more than 10 km still resort to walking to reach the health facility. Furthermore, the widespread reliance on walking and motorcycles suggests potential vulnerability to weather, road conditions, or safety concerns, especially for individuals in rural areas and women.
Proportion | MOE (Prop) | 95% CI | LCB | UCB | DEFF | Estimated Total | MOE (Total) | Unweighted Cases | |
|---|---|---|---|---|---|---|---|---|---|
Walking | 57.2% | ±3.2 | (54.0; 60.4) | 54.6% | 59.9% | 24.03 | 723,468 | ±57,751 | 13,499 |
Motorcycle | 23.5% | ±2.4 | (21.1; 26.0) | 21.5% | 25.6% | 19.06 | 296,552 | ±32,918 | 5,391 |
Public transportation (e.g., bus, taxi) | 9.0% | ±1.8 | (7.4; 11.0) | 7.6% | 10.6% | 22.86 | 113,801 | ±22,106 | 1,613 |
Three-wheeler | 7.2% | ±1.3 | (6.0; 8.7) | 6.2% | 8.5% | 15.64 | 91,531 | ±16,798 | 1,372 |
Bicycle | 2.0% | ±1.4 | (1.0; 4.0) | 1.2% | 3.6% | 55.23 | 25,791 | ±18,399 | 458 |
Private car | 0.8% | ±0.6 | (0.4; 1.7) | 0.4% | 1.5% | 28.80 | 10,031 | ±7,842 | 101 |
Other | 0.2% | ±0.1 | (0.1; 0.4) | 0.1% | 0.3% | 3.53 | 2,791 | ±1,432 | 52 |
Don't know | 16,039 | ±3,673 | 292 | ||||||
Refuse to answer | 8,020 | ±4,980 | 91 | ||||||
All | 100.0% | 100.0% | 100.0% | 1,288,024 | ±64,766 | 22,869 | |||
Abbreviations: CI = Confidence Interval; MOE = Margin of Error; LCB = Lower Confidence Bound; UCB = Upper Confidence Bound; DEFF = Design Effect; Domain sample size = 22,869 | |||||||||
4.3.3.2 Service Availability
As shown in Figure 4.66, zero-dose children have caregivers who are not only more likely to say that vaccination services are not offered at the nearest health facility (14%), but often who do not simply know whether such services exist (15%). In contrast, among children who were vaccinated with Penta-1, only 1% has caregivers who are unaware of local vaccination services. The remaining 10% with caregivers who report no nearby services could reflect those who made the effort to visit more distant facilities because they value immunization.
Vaccination services are reported as slightly more available in Nassarawa (88%) than in the other survey areas (between 81–83%), as seen in Figure 4.67.
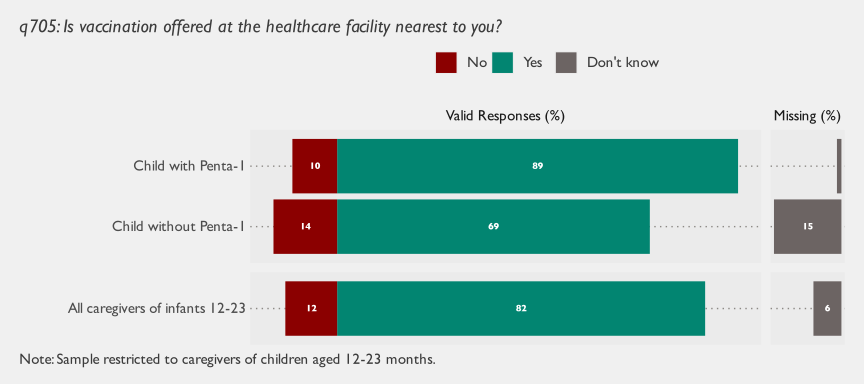
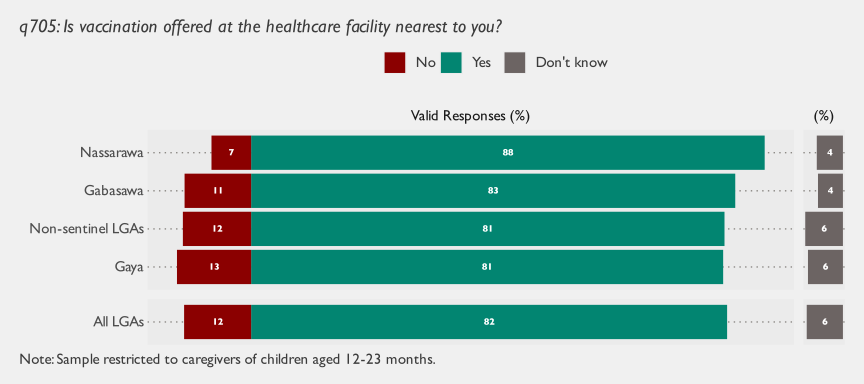
Vaccination service availability, as reported by caregivers, is heavily concentrated on weekdays, especially Monday through Thursday, with limited or no provision on Fridays and weekends (Table 4.80). Additionally, almost one in ten children has caregivers who do know on which days vaccination is available.
Proportion | MOE (Prop) | 95% CI | LCB | UCB | DEFF | Estimated Total | MOE (Total) | Unweighted Cases | |
|---|---|---|---|---|---|---|---|---|---|
Monday | 33.2% | ±4.1 | (29.2; 37.4) | 29.8% | 36.7% | 31.75 | 302,756 | ±43,109 | 5,521 |
Tuesday | 34.6% | ±4.3 | (30.5; 39.0) | 31.1% | 38.3% | 33.99 | 315,711 | ±46,004 | 5,828 |
Wednesday | 29.5% | ±3.4 | (26.2; 33.1) | 26.7% | 32.5% | 23.64 | 269,472 | ±35,045 | 5,657 |
Thursday | 34.5% | ±4.2 | (30.4; 38.9) | 31.0% | 38.1% | 33.20 | 314,843 | ±45,367 | 5,033 |
Friday | 11.2% | ±1.7 | (9.5; 13.0) | 9.8% | 12.7% | 12.81 | 101,904 | ±15,132 | 1,893 |
Saturday | 1.3% | ±0.4 | (0.9; 1.8) | 1.0% | 1.7% | 6.05 | 11,931 | ±4,100 | 212 |
Sunday | 0.8% | ±0.3 | (0.5; 1.2) | 0.6% | 1.1% | 5.25 | 7,303 | ±2,961 | 107 |
Don't know | 8.8% | ±1.1 | (7.7; 10.0) | 7.8% | 9.8% | 6.87 | 79,952 | ±11,980 | 1,162 |
Refuse to answer | 0.1% | ±0.1 | (0.0; 0.3) | 0.0% | 0.3% | 6.26 | 842 | ±1,075 | 4 |
Abbreviations: CI = Confidence Interval; MOE = Margin of Error; LCB = Lower Confidence Bound; UCB = Upper Confidence Bound; DEFF = Design Effect; Domain sample size = 16,097; Note: Because answers follow a select-multiple format, proportions in this table do not necessarily sum to 100% | |||||||||
Vaccinated children are more likely to have caregivers who report both that vaccines were unavailable at some point in the past six months (25%) and that they were always available (68%) (Figure 4.68). Intuitively, caregivers who value and engage with routine immunization services are more connected to the local health system, and therefore more likely to notice both its successes and its shortcomings.
In contrast, only 9% of zero-dose children have caregivers who report stockouts, and 54% who report no stockouts. Strikingly, 37% of these children has caregivers who do not know whether stockouts occurred at all. This suggests that a large proportion of caregivers of zero-dose children have so little interaction with the health system that they are not in a position to observe supply issues. Therefore, while stockouts are a genuine barrier for many, they may not be the main reason zero-dose children are missed: limited caregiver engagement with the health system appears to be a bigger challenge.
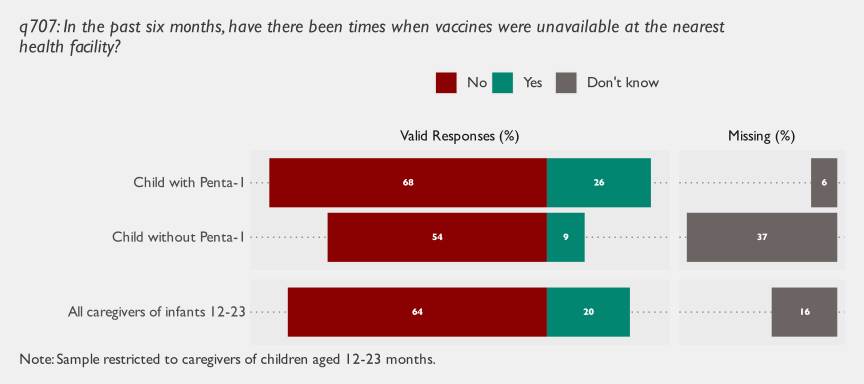
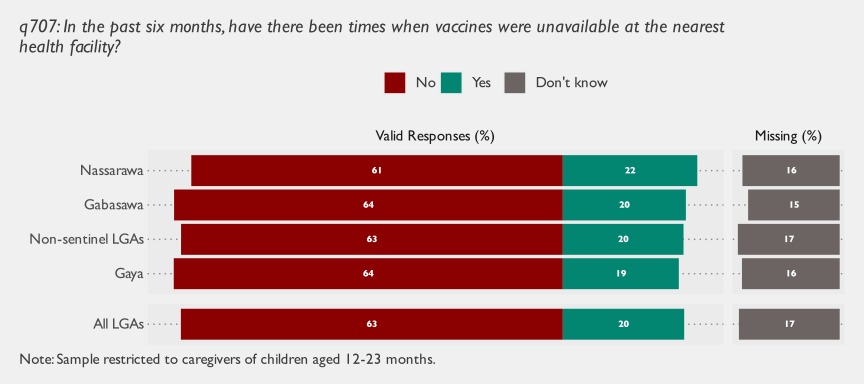
4.3.3.3 Information Environment
The analysis reveals important gaps in caregivers’ exposure to vaccination information. As shown in Figure 4.71, just over half of children (57%) have caregivers who report having ever heard or seen information about vaccines or vaccination. The trend varies by location: children in Nassarawa are the most likely to have a caregiver with reported exposure (62%), while Gaya and Gabasawa display lower figures, at 49% and 50% respectively.
A clearer divide also emerges when examining vaccination status (Figure 4.70). Among Penta-1 vaccinated children, 64% have caregivers who report having received such information, compared to just 45% among zero-dose children.
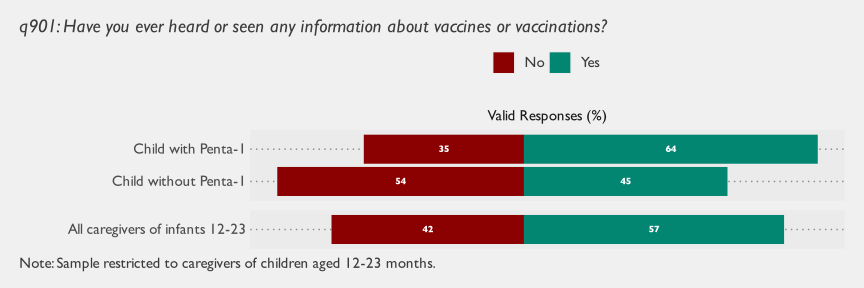
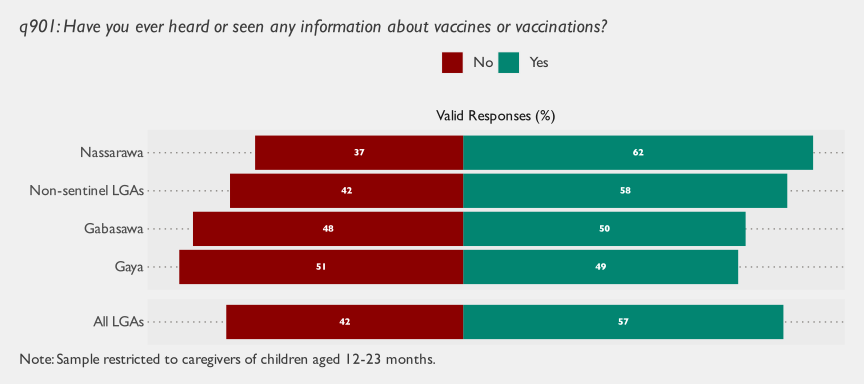
When caregivers do receive information, health workers are by far the most common source (Figure 4.72). However, vaccinated children are much more likely to have caregivers who receive information from health workers and community leaders. By contrast, zero-dose children are more likely to have caregivers who rely on family or friends, or the radio/TV, as their main sources of health information.
Community health campaigns as well as schools or educational institutions play smaller roles overall, though schools are more commonly mentioned by caregivers of vaccinated children.
These patterns suggest that zero-dose children are more often in environments where informal or less authoritative information channels dominate, while vaccinated children are more likely to benefit from caregivers who are better connected to formal health communication sources.
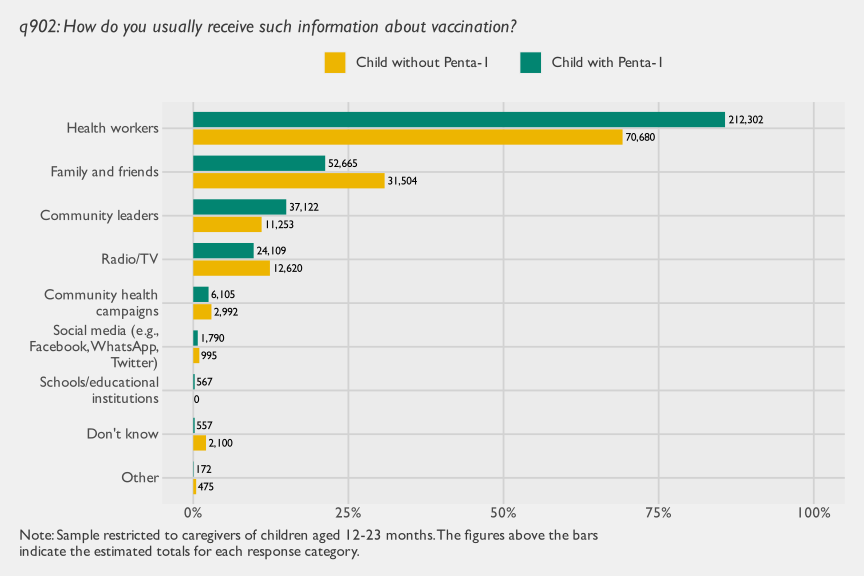
Awareness of vaccination campaigns appears limited overall, with slight variation between groups. As shown in Figure 4.74, across all LGAs, only about 21% of children have caregivers who say they are aware of vaccination campaigns in their area. Gabasawa shows the highest level at 25%, while Gaya is at the lower end with 18%.
Intuitively, vaccinated children are more likely to have caregivers who report awareness of campaigns: 24% compared to 16% among zero-dose children (Figure 4.73).
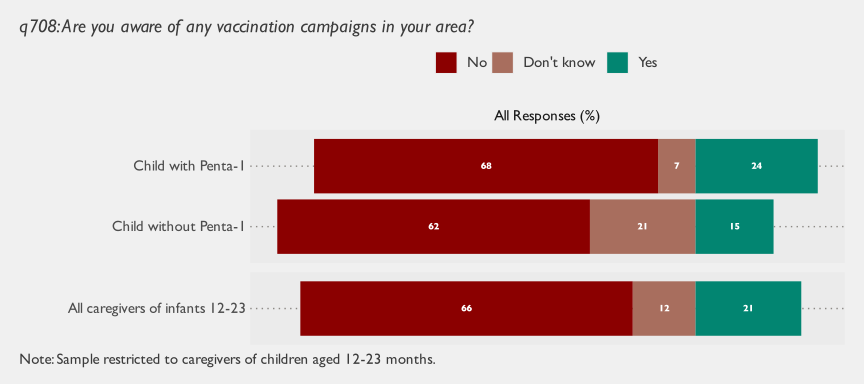
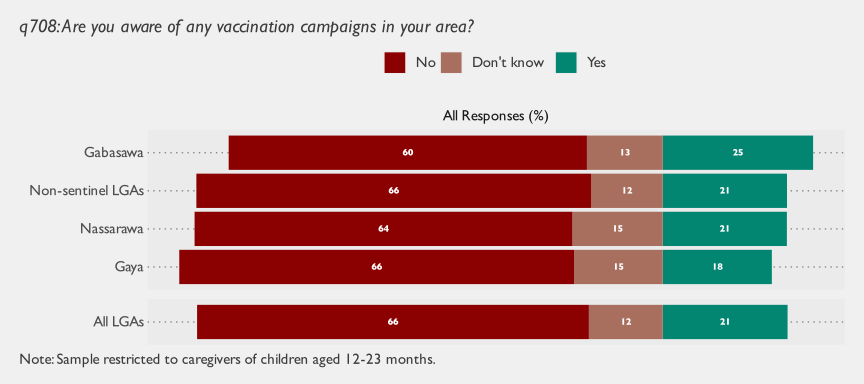
Community leaders and local organizations play an important role in promoting vaccination in Kano State, but their impact and visibility varies (Figure 4.75). Overall, only about 41% of children have caregivers who report that community leaders or organizations have actively promoted vaccination campaigns. This figure is highest in Gabasawa (51%) and Gaya (46%), while Nassarawa and non-sentinel LGAs are slightly lower (at 39% and 40% respectively).
Unsurprisingly, vaccinated children are more likely to have caregivers who report active promotion by community leaders and local organizations (45%) compared to zero-dose children (33%) (Figure 4.76).
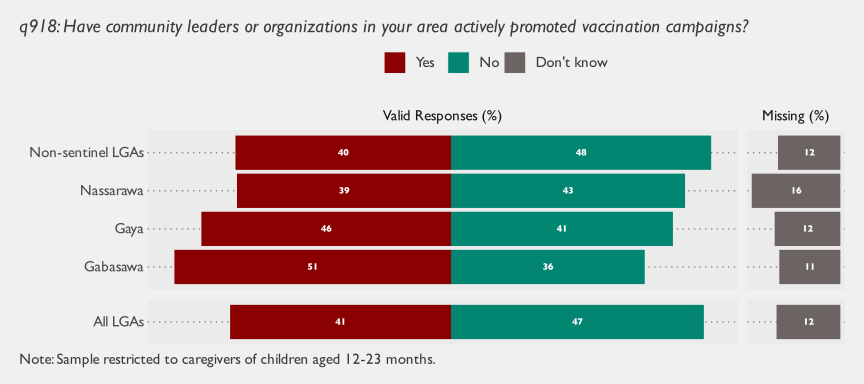
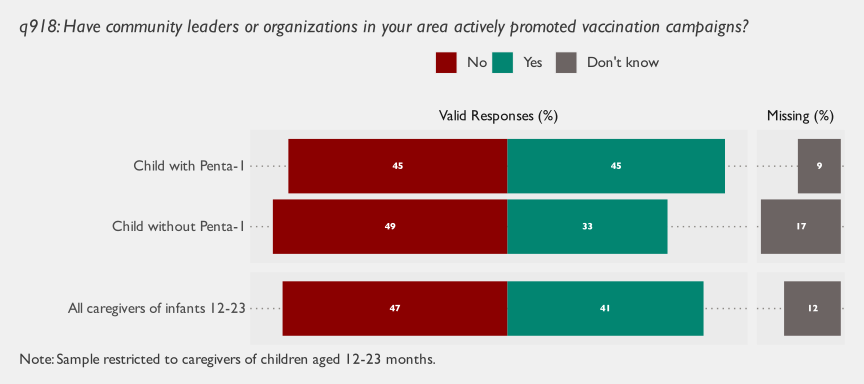
The patterns observed about vaccination campaigns and the role of community leaders align with broader findings on the information environment: vaccinated children are generally in households where caregivers are more exposed to or aware of formal vaccination efforts and leadership figures, while zero-dose children are more likely to come from households that are disconnected from such information.
4.3.4 Expenses Related to Vaccination
Figure 4.77 and Figure 4.78 highlight how caregivers perceive the burden of paying for vaccinations, considering clinic fees, travel costs, and lost income from taking time away from work.
While financial barriers may exist for a few, the majority of caregivers do not see paying for vaccination as a burden. Most children, across both groups and survey areas, have caregivers who reported that paying for vaccination was “very easy.”
This perception was strongest among caregivers of children aged 12–23 months who had received the Penta-1 vaccine (68%), compared to 40% of those whose children had not. In fact, a sizable proportion of caregivers whose children did not receive Penta-1 is unable to report about the easiness to pay for the vaccination.
Similarly, when looking at survey areas, the proportion reporting it as “very easy” hovered between 55% and 59%, with only minor differences between LGAs.
Across all groups, only a small minority (5–8%) found the costs “not at all easy” to manage.
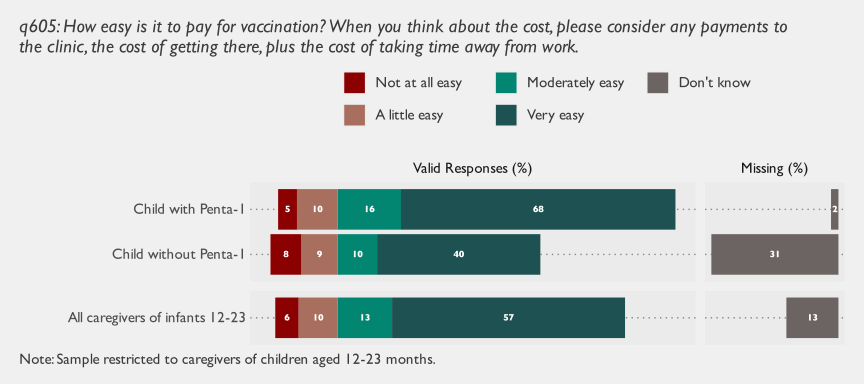
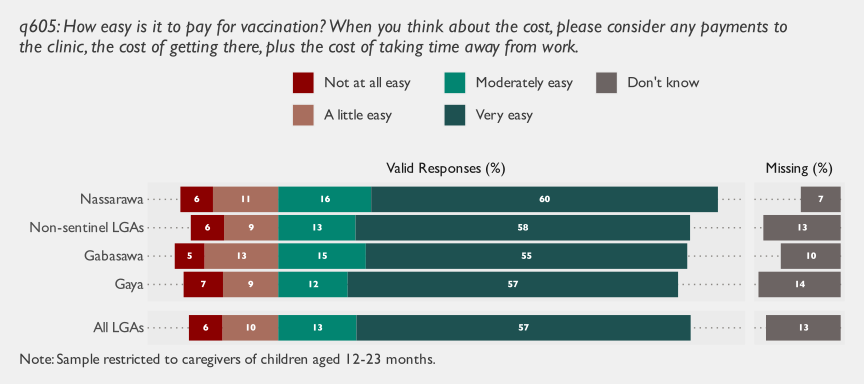
While most children had caregivers who described the cost of vaccination as easy to manage, Table 4.82 reveals that a significant portion is noticing higher costs of vaccination relative to the previous visit. In fact, an estimated 41% of children had caregivers who felt that the cost of their child’s most recent vaccination was at least “slightly” if not “much more” than what they had paid previously, compared to only 20.8% who perceived a decrease.
This suggests that although caregivers generally find it easy to cover vaccination costs, a sizable portion is finding it more expensive than the previous vaccinations. If sustained over time, this trend could start to erode the prevailing sense that vaccination is affordable, as shown in Figure 4.77 and Figure 4.78. Nevertheless, perceptions may vary and are subject to change; higher costs may also be viewed within the broader economic context rather than necessarily reflecting the true underlying cost of vaccination.
Survey area | Zero-dose status | Not at all easy | A little easy | Moderately easy | Very easy | Refuse to answer | Don't know | ||||||
|---|---|---|---|---|---|---|---|---|---|---|---|---|---|
% | Est. total | % | Est. total | % | Est. total | % | Est. total | % | Est. total | % | Est. total | ||
Gabasawa | Child without Penta-1 | 5.5% | 624 | 13.2% | 1,515 | 11.1% | 1,265 | 39.4% | 4,513 | 4.5% | 515 | 26.3% | 3,013 |
Child with Penta-1 | 4.9% | 1,138 | 12.4% | 2,859 | 17.1% | 3,935 | 63.1% | 14,554 | 0.2% | 36 | 2.3% | 540 | |
All caregivers of children 12-23 | 5.1% | 1,761 | 12.7% | 4,374 | 15.1% | 5,200 | 55.3% | 19,067 | 1.6% | 551 | 10.3% | 3,553 | |
Gaya | Child without Penta-1 | 9.3% | 1,267 | 6.6% | 892 | 9.0% | 1,221 | 38.5% | 5,220 | 1.9% | 264 | 34.7% | 4,711 |
Child with Penta-1 | 5.2% | 1,160 | 11.3% | 2,511 | 13.8% | 3,066 | 68.0% | 15,150 | 0.2% | 45 | 1.6% | 358 | |
All caregivers of children 12-23 | 6.8% | 2,427 | 9.5% | 3,403 | 12.0% | 4,287 | 56.8% | 20,371 | 0.9% | 309 | 14.1% | 5,069 | |
Nassarawa | Child without Penta-1 | 5.4% | 437 | 15.0% | 1,207 | 12.8% | 1,032 | 44.8% | 3,616 | 2.0% | 164 | 19.9% | 1,609 |
Child with Penta-1 | 5.7% | 1,350 | 9.9% | 2,370 | 17.1% | 4,072 | 64.6% | 15,401 | 0.3% | 70 | 2.4% | 578 | |
All caregivers of children 12-23 | 5.6% | 1,787 | 11.2% | 3,577 | 16.0% | 5,104 | 59.6% | 19,018 | 0.7% | 235 | 6.9% | 2,187 | |
Non-sentinel LGAs | Child without Penta-1 | 7.7% | 15,046 | 8.6% | 16,838 | 9.6% | 18,831 | 40.2% | 78,823 | 2.0% | 3,883 | 31.9% | 62,422 |
Child with Penta-1 | 4.5% | 14,217 | 9.7% | 30,707 | 15.6% | 49,173 | 68.2% | 215,244 | 0.2% | 569 | 1.8% | 5,560 | |
All caregivers of children 12-23 | 5.7% | 29,263 | 9.3% | 47,545 | 13.3% | 68,004 | 57.5% | 294,067 | 0.9% | 4,452 | 13.3% | 67,982 | |
All LGAs | Child without Penta-1 | 7.6% | 17,373 | 8.9% | 20,452 | 9.8% | 22,349 | 40.3% | 92,173 | 2.1% | 4,826 | 31.3% | 71,755 |
Child with Penta-1 | 4.6% | 17,865 | 10.0% | 38,446 | 15.7% | 60,246 | 67.7% | 260,350 | 0.2% | 720 | 1.8% | 7,036 | |
All caregivers of children 12-23 | 5.7% | 35,238 | 9.6% | 58,898 | 13.5% | 82,595 | 57.5% | 352,522 | 0.9% | 5,546 | 12.8% | 78,791 | |
Note: Sample restricted to caregivers of children aged 12-23 months. Table entries refer to the estimated percentage and number of children with caregivers who responded to the following survey question: "How easy is it to pay for vaccination? When you think about the cost, please consider any payments to the clinic, the cost of getting there, plus the cost of taking time away from work." CIs are reported in parentheses. | |||||||||||||
Cumulative Proportion | Proportion | MOE (Prop) | 95% CI | LCB | UCB | DEFF | Estimated Total | MOE (Total) | Unweighted Cases | |
|---|---|---|---|---|---|---|---|---|---|---|
Much more than the previous cost | 25.0% | 25.0% | ±5.1 | (20.2; 30.4) | 21.0% | 29.5% | 21.07 | 127,112 | ±325,122 | 1,592 |
Slightly more than the previous cost | 36.5% | 11.5% | ±3.0 | (8.9; 14.8) | 9.2% | 14.2% | 13.09 | 58,507 | ±123,904 | 828 |
About the same as the previous cost | 77.9% | 41.5% | ±3.0 | (38.5; 44.5) | 39.0% | 44.0% | 5.72 | 210,951 | ±473,281 | 2,121 |
Slightly less than the previous cost | 88.4% | 10.4% | ±3.7 | (7.3; 14.7) | 7.7% | 13.9% | 21.82 | 52,990 | ±95,550 | 640 |
Much less than the previous cost | 100.0% | 11.6% | ±1.5 | (10.2; 13.2) | 10.5% | 12.9% | 3.25 | 59,270 | ±132,448 | 705 |
All | 100.0% | 99.9% | 100.0% | 508,829 | ±1,136,602 | 5,886 | ||||
Abbreviations: CI = Confidence Interval; MOE = Margin of Error; LCB = Lower Confidence Bound; UCB = Upper Confidence Bound; DEFF = Design Effect; Domain sample size = 5,886 | ||||||||||
Note: Sample restricted to caregivers of children aged 12-23 months. | ||||||||||
4.3.4.1 Direct Out-of-Pocket Costs
Figure 4.79 displays estimated percentage of households reporting any vaccination-related expenses, by type of expense. Nearly 75% of caregivers across LGAs reported spending some amount to get their children vaccinated. Medications (e.g., to treat vaccine side effects) were a common expense, affecting around half of households across survey areas. Other important costs included food and transportation (particularly in urban Nassarawa), each reported by a substantial share of respondents.
Expenses for registration, vaccination cards or supplies were instead rare, affecting less than one family in ten in all LGAs.
While health facilities rarely charge fees for registration and cards, families still face other costs that can add up.
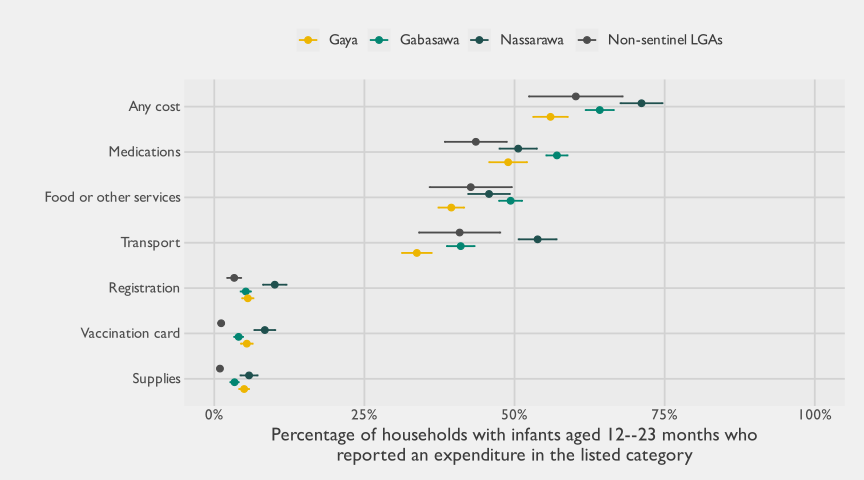
On average, households spent ₦946 ($0.62) per visit across LGAs, with costs ranging from ₦681 ($0.44) in Gaya to ₦1,824 ($1,19) in Nassarawa.21 The median cost was lower at ₦500 ($0.33), suggesting that a few outlier households are pulling up the average. This pattern is especially clear in Nassarawa, where the average cost reached ₦1,824 but the median was just ₦500. Gaya displays the lowest median at ₦200 ($0,13), alongside the lowest average.
Survey area | Average cost | Median cost | ||
|---|---|---|---|---|
Estimate | 95% CI | Estimate | 95% CI | |
Gabasawa | ₦ 970 | (₦ 888; ₦ 1,051) | ₦ 500 | (₦ 500; ₦ 600) |
Gaya | ₦ 690 | (₦ 631; ₦ 748) | ₦ 200 | (₦ 200; ₦ 300) |
Nassarawa | ₦ 2,062 | (₦ 1,023; ₦ 3,101) | ₦ 500 | (₦ 500; ₦ 700) |
Non-sentinel LGAs | ₦ 817 | (₦ 684; ₦ 951) | ₦ 500 | (₦ 500; ₦ 800) |
All LGAs | ₦ 865 | (₦ 725; ₦ 1,006) | ₦ 500 | (₦ 500; ₦ 800) |
Note: Sample restricted to caregivers of children aged 12-23 months. Estimates refer to the total amount households spent, including transportation, fees, and other expenses. Amounts are expressed in Nigerian naira (₦). | ||||
Survey area | Zero-dose status (household) | Average cost | Median cost | ||
|---|---|---|---|---|---|
Estimate | 95% CI | Estimate | 95% CI | ||
Gabasawa | Non-zero-dose household | ₦ 985 | (₦ 898; ₦ 1,072) | ₦ 500 | (₦ 500; ₦ 600) |
Zero-dose household | ₦ 794 | (₦ 585; ₦ 1,002) | ₦ 150 | (₦ 0; ₦ 500) | |
All households with children 12-23 | ₦ 970 | (₦ 888; ₦ 1,051) | ₦ 500 | (₦ 500; ₦ 600) | |
Gaya | Non-zero-dose household | ₦ 679 | (₦ 616; ₦ 742) | ₦ 200 | (₦ 200; ₦ 300) |
Zero-dose household | ₦ 808 | (₦ 637; ₦ 979) | ₦ 300 | (₦ 0; ₦ 600) | |
All households with children 12-23 | ₦ 690 | (₦ 631; ₦ 748) | ₦ 200 | (₦ 200; ₦ 300) | |
Nassarawa | Non-zero-dose household | ₦ 2,101 | (₦ 1,029; ₦ 3,174) | ₦ 500 | (₦ 500; ₦ 700) |
Zero-dose household | ₦ 839 | (₦ 519; ₦ 1,159) | ₦ 700 | (₦ 300; ₦ 1,200) | |
All households with children 12-23 | ₦ 2,062 | (₦ 1,023; ₦ 3,101) | ₦ 500 | (₦ 500; ₦ 700) | |
Non-sentinel LGAs | Non-zero-dose household | ₦ 799 | (₦ 675; ₦ 924) | ₦ 500 | (₦ 500; ₦ 800) |
Zero-dose household | ₦ 1,232 | (₦ 644; ₦ 1,820) | ₦ 500 | (₦ 100; ₦ 1,300) | |
All households with children 12-23 | ₦ 817 | (₦ 684; ₦ 951) | ₦ 500 | (₦ 500; ₦ 800) | |
All LGAs | Non-zero-dose household | ₦ 852 | (₦ 719; ₦ 984) | ₦ 500 | (₦ 500; ₦ 800) |
Zero-dose household | ₦ 1,167 | (₦ 667; ₦ 1,668) | ₦ 500 | (₦ 200; ₦ 1,300) | |
All households with children 12-23 | ₦ 865 | (₦ 725; ₦ 1,006) | ₦ 500 | (₦ 500; ₦ 800) | |
Note: Sample restricted to caregivers of children aged 12-23 months. Estimates refer to the total amount households spent, including transportation, fees, and other expenses. Amounts are expressed in Nigerian naira (₦). The term "zero-dose household" refers to a household where at least one age-eligible child has not received a Penta-1 vaccine. | |||||
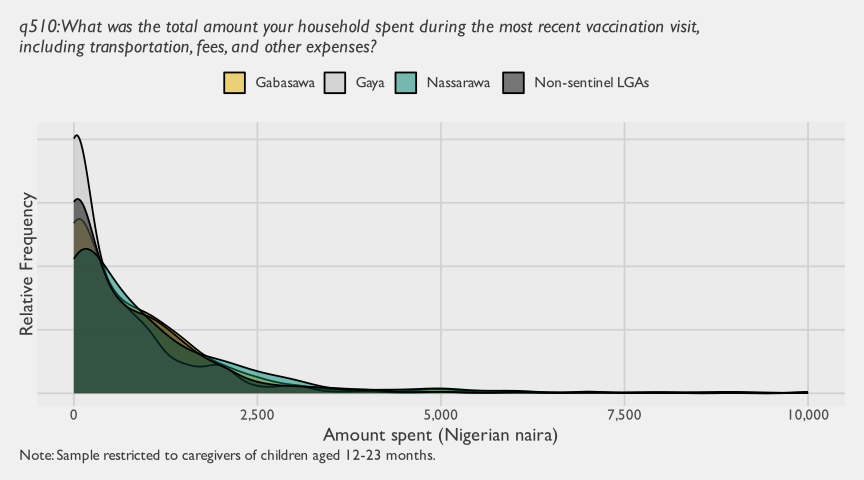
Table 4.85 shows what categories drive household costs for vaccination. Across all LGAs, the category for food or other services22 costs (₦498, or $0.33) accounts for the largest share of household spending during vaccination visits (though the average in this category vary greatly across areas, and are especially high in Nassarawa). The food/other category is followed by medication (₦339, or $0.22) and transport (₦335, or $0.22).
Registration, supplies, and vaccination cards each added only small amounts, on average under ₦50.
These figures reinforce the pattern seen earlier: the bulk of vaccination-related spending comes from other costs rather than fees charged by health facilities. Such costs are not only more common, as shown in Table 4.83, but also higher on average.
Survey area | Registration | Medication | Food | Supplies | Vaccination card | Transport | Total |
|---|---|---|---|---|---|---|---|
Gabasawa | ₦26 | ₦360 | ₦388 | ₦27 | ₦22 | ₦359 | ₦970 |
Gaya | ₦34 | ₦264 | ₦270 | ₦28 | ₦35 | ₦323 | ₦690 |
Nassarawa | ₦47 | ₦522 | ₦5184 | ₦43 | ₦33 | ₦485 | ₦2062 |
Non-sentinel LGAs | ₦23 | ₦283 | ₦295 | ₦4 | ₦7 | ₦293 | ₦817 |
All LGAs | ₦24 | ₦294 | ₦482 | ₦7 | ₦10 | ₦303 | ₦865 |
Note: Sample restricted to caregivers of children aged 12-23 months. Estimates refer to the total amount households spent, including transportation, fees, and other expenses. Amounts are expressed in Nigerian naira (₦). | |||||||
4.3.4.2 Indirect Costs
This section sheds light on the more indirect costs households face for vaccination.
For more than eight visits out of ten, only one person made the trip (likely the primary caregiver and child), while about 11% involved two people (Table 4.86). While most households limit the number of travelers, the fact that one in ten visits involved at least two people means transport and food costs can double or more for those families.
Cumulative Proportion | Proportion | MOE (Prop) | 95% CI | LCB | UCB | DEFF | Estimated Total | MOE (Total) | Unweighted Cases | |
|---|---|---|---|---|---|---|---|---|---|---|
1 | 87.2% | 87.2% | ±3.5 | (83.2; 90.3) | 83.9% | 89.9% | 22.82 | 591,539 | ±1,389,850 | 6,545 |
2 | 96.8% | 9.6% | ±2.1 | (7.6; 11.9) | 7.9% | 11.5% | 10.69 | 64,961 | ±133,780 | 1,011 |
3 | 99.1% | ** | ** | ** | ** | ** | 51.10 | 15,540 | ±63,771 | 158 |
4 | 100.0% | 0.9% | ±1.2 | (0.3; 3.3) | 0.3% | 2.7% | 31.30 | 6,386 | ±27,711 | 93 |
All | 100.0% | 100.0% | 100.0% | 678,426 | ±1,599,202 | 7,807 | ||||
Abbreviations: CI = Confidence Interval; MOE = Margin of Error; LCB = Lower Confidence Bound; UCB = Upper Confidence Bound; DEFF = Design Effect; Domain sample size = 7,807; Potentially unreliable values have been suppressed and marked with asterisks (reason(s): The absolute CI width is ≥5% and the relative CI width is ≥130%) | ||||||||||
Note: Sample restricted to caregivers of children aged 12-23 months. | ||||||||||
Vaccination visits require a considerable time investment, as shown in Table 4.87. This includes travel time, waiting time, time spent at the health facility after receiving the vaccine, and the time to get back home. For caregivers who work, this can involve a significant tradeoff with time that could have been spent on other income-generating activities, adding to the indirect cost of vaccination. On average, households spent between 5.7 and 6.3 hours for a vaccination visit, with Gabasawa and non-sentinel LGAs showing the longest average times (at 6.3 and 6.2 hours, respectively), and Nassarawa showing the lowest (at 5.7 hours). The differences in average time between survey areas is statically significant in a regression-based Wald test \((F_{(3, 496)}=43.2\), \(p<.001)\).
Survey area | Travel to the health facility | Wait to receive vaccine | Wait after receiving vaccine | Return home | Total |
|---|---|---|---|---|---|
Gabasawa | 1.4 hours | 2.1 hours | 1.4 hours | 1.4 hours | 6.3 hours |
Gaya | 1.3 hours | 2 hours | 1.4 hours | 1.3 hours | 6 hours |
Nassarawa | 1.1 hours | 2 hours | 1.4 hours | 1.2 hours | 5.7 hours |
Non-sentinel LGAs | 1.2 hours | 2.3 hours | 1.5 hours | 1.3 hours | 6.2 hours |
All LGAs | 1.2 hours | 2.3 hours | 1.5 hours | 1.3 hours | 6.2 hours |
Note: Sample restricted to caregivers of children aged 12-23 months. The calculations include the time spent traveling to the health facility (q511) for the most recent vaccination, waiting (q512), as well as the additional time they spent at the site after receiving it (q513) and traveling back home (q514). CIs are reported in parentheses. | |||||
Unlike for other vaccines, the survey instrument did not ask caregivers to recall meningitis, Vitamin A or YF on a named vaccine-by-vaccine basis. Instead, for these three vaccines, caregivers were asked to list any other vaccines that they could recall after enumerators attempted to review HBRs and after enumerators asked about other explicitly named vaccines. Because of this difference in instrumentation, coverage rates for meningitis, Vitamin A and YF may be slightly lower than if recall questions for these vaccines had followed the same named format as the other antigens.↩︎
The degree of urbanization in this analysis is based on the open-source Global Human Settlement Layer Settlement Model (SMOD) geospatial layer from the Global Human Settlement Layer (GHSL) project (Florczyk et al. 2019).↩︎
MCV-2 is excluded from the analysis because not all children aged 12–23 months are yet eligible. Although it can be included, doing so requires care to avoid unintentionally restricting the analysis domain for other vaccine pairs.↩︎
The authors have chosen to display the probability of receiving a Penta-1 vaccine prior to six weeks even though, in theory, most children should not receive this vaccine prior to this point. The reason for this is threefold. First, it serves as a visual validation check. Second, it showcases that a small proportion of caregivers report that their child received the vaccine prior to six weeks (whether true or not). Third, this approach aligns with the standard approach of reporting survival curves used by VCQI.↩︎
The prevalence maps in this section use unweighted indicator kriging models to estimate the prevalence of vaccine coverage. GRID3 settlement extents are used to mask uninhabited areas from the map (Center for International Earth Science Information Network (CIESIN), Columbia University 2024).↩︎
These cutoffs were arbitrarily chosen by the research team but can easily be changed. Although overlap is possible, the plot shows that these two approaches tend to highlight different geographic areas.↩︎
In the footnotes of its 2023-24 report, the NDHS notes that it considers children who have received a combination of different polio vaccines to be fully immunized if the other basic antigens have been fully administered. This less orthodox approach to encoding polio differs from the conventional approach advocated by the World Health Organization (WHO) (which requires two doses of IPV and three doses of OPV), but for the present study, does not make a large difference in the findings. A trivially small number of children would be classified differently using this more complex polio encoding rule, and for this reason, only the conventional basic antigen definition is presented here.↩︎
Selection and inference are both design-weighted: at each step a candidate’s contribution is measured by its design-based Wald \(\chi^2\) statistic, and a term is admitted (or kept) iff its Wald \(\chi^2\) exceeds twice its degrees of freedom — the AIC-equivalent criterion under the \(\chi^2\) approximation \(W \approx -2\log\Lambda\).↩︎
A Brant test of the proportional-odds assumption is significant (p <0.001), confirming that effects differ across thresholds. The test is computed on an unweighted
MASS::polrfit because no design-based Brant test exists; the violation magnitude is large enough that the unweighted test remains informative. A design-based partial-proportional-odds variant that would relax the assumption does not converge on this sample (the unweighted version, Table 4.63, does), so the proportional-odds specification is retained for inference.↩︎For the designation of urban/rural households, the team relied on the official classification approved by the Statistician General of the Kano Bureau of Statistics (Appendix E).↩︎
The Pathways decision tree was applied with several adaptations to align with the design of the household survey. First, because men were also respondents, the fertility question was phrased as “Have you, or a spouse of yours, ever given birth?” rather than the original “Have you ever given birth?” Second, for sanitation, the original split grouped all non-flush toilets together, but Mindset revised it to distinguish flush toilets from pit latrines, bucket toilets, and no facility/bush/field. Third, fuel use was collected as a “select multiple” item rather than “select one.” This created ambiguity for households reporting more than one fuel type (e.g., wood and gas). To resolve this, Mindset classified households based on the more advanced fuel type present, so a household reporting both wood and natural gas would be coded as using natural gas when the tree split on fuel type.↩︎
These figures are reported for illustrative purposes and come from a back-of-the-envelope calculation of weighted dropout rates (for instance, \((62.7-59.3)/62.7\approx0.05\) for DPT1–3).↩︎
Note: The Intraclass Correlation Coefficient (ICC) displayed in the Vaccination Coverage and Timeliness Chart (VCTC) plots currently has a different interpretation for sentinel and non-sentinel areas. For sentinel LGAs, the ICC represents the expected degree of homogeneity within a building. For non-sentinel LGAs, it reflects the expected degree of homogeneity within an EA. More meaningful and design-aligned analyses of ICC can be found in (Mindset 2026)↩︎
Note: The ICC displayed in the VCTC plots currently has a different interpretation for sentinel and non-sentinel areas. For sentinel LGAs, the ICC represents the expected degree of homogeneity within a building. For non-sentinel LGAs, it reflects the expected degree of homogeneity within an EA. More meaningful and design-aligned analyses of ICC can be found in (Mindset 2026)↩︎
Children aged 6–23 months are used rather than the more conventional 12–23 months to maximize the available training data and thereby increase the model’s statistical power to detect predictors of zero-dose status. Zero-dose classification is relatively stable between 6 and 12 months, and there is no strong a priori reason to expect the underlying drivers of non-vaccination to differ meaningfully between these sub-groups.↩︎
The regression was restricted to sentinel LGAs because survey weights differ substantially between sentinel and non-sentinel areas: the non-sentinel LGAs are each represented by far fewer sampled households relative to their actual population weight, which would give those observations disproportionate leverage over the model fit. Restricting to the sentinel areas yields a more balanced and reliable basis for estimation. This parallels the same rationale used elsewhere in this report to focus spatial hotspot analyses on sentinel areas.↩︎
Candidate predictors were drawn from the full household and caregiver questionnaire. Variables were included only if at least 90% of values were present; for the remaining gaps, missing values were filled in by drawing on responses from the ten most similar children, where similarity was assessed across the categorical survey items. Variables with near-zero variance, high cardinality, or a trivially redundant relationship to zero-dose status (such as possession of a vaccine card, administrative bookkeeping fields, and interview timing variables) were excluded before the selection procedure. After these screens, candidate predictors entered the variable-selection procedure. A pseudo-R-squared circuit-breaker was applied as a stopping rule: variable admission was governed by improvement in the design-based AIC, while the loop terminated as soon as a step’s gain in Nagelkerke pseudo-R-squared fell below 0.01. The variable that triggered termination was retained, since it was selected on AIC grounds; subsequent steps were not attempted. These screening and gap-filling steps were computed once across the full survey sample for efficiency, before restricting the regression to sentinel children. As a sensitivity check we re-ran the entire procedure restricted to sentinel children only: the missingness screen retained 185 candidate variables in the full-sample computation but 187 when restricted to sentinel children, but the variable-selection routine chose the same predictors out of either pool, and the resulting odds-ratio estimates were numerically identical to those reported here.↩︎
Forward stepwise selection is a useful exploratory tool when many candidate variables are available: it heuristically identifies variables most strongly associated with the outcome, filtering out predictors whose apparent association becomes negligible once other variables are controlled for. Its limitations are worth noting: depending on implementation, forward selection can overfit, picking up spurious associations that may not generalise beyond the training data. It also optimises for predictive fit, which is not always equivalent to what is most useful for explanation or policy — a model that predicts well may include proxy variables and miss clinically or programmatically relevant predictors. Some human review of the selected terms is therefore warranted alongside any statistical interpretation.↩︎
The cross-validation procedure randomly partitioned the 32 sentinel survey strata into five folds, with roughly 6 to 7 strata per fold. In each fold, one grouped holdout fold was used as the test set while the model formula was refit on the remaining 25 to 26 strata; predictions were then generated for the held-out fold. The “All areas” row reports each metric computed once over the held-out predictions concatenated across all five folds, rather than averaged across the per-fold values. This provides an honest estimate of how well the model generalizes to unseen geographic areas within Kano State, and guards against over-optimistic in-sample performance estimates.↩︎
This squared correlation is computed between predicted probabilities and observed zero-dose indicators across all held-out strata, and is typically somewhat lower than the Nagelkerke pseudo-R-squared reported in Table 4.74. The Nagelkerke pseudo-R-squared is a rescaled in-sample goodness-of-fit measure normalized to the [0, 1] range, which tends to produce higher values than the cross-validated equivalent. The two metrics are therefore not directly comparable; the cross-validated squared correlation is the more conservative and externally valid estimate of how tightly the model’s predictions track the observed outcome.↩︎
Exchange rate of 1531.6 Naira to the US Dollar as of July 7th, 2025.↩︎
In the survey questionnaire, response option q505 was coded as “Food or other services,” which prevents distinguishing expenditures on food from those in the residual “Other” category. A more informative design would have separated these items.↩︎